Power Query Editor in Power BI Desktop empowers you to mold (transform) your imported data. This involves tasks like renaming columns or tables, converting text to numbers, eliminating unnecessary rows, establishing the first row as headers, and more. The process of shaping data is crucial to align it with your requirements, ensuring its suitability for report creation.
You've imported raw sales data from two origins into a Power BI model. One portion originated from a manually created .csv file in Microsoft Excel by the Sales team. The other segment was loaded through a link to your organization's Enterprise Resource Planning (ERP) system. Upon reviewing the data in Power BI Desktop, discrepancies are evident, with some unwanted data and incorrectly formatted information.
To rectify this, you must utilize Power Query Editor to clean up and structure the data, laying the foundation for the subsequent report development.
Getting started with PowerQuery Editor
Within Power Query Editor, your chosen query's data is displayed at the center of the screen, while the Queries pane on the left enumerates the available queries (tables).

As you engage in tasks within Power Query Editor to structure your data, each action is recorded. Subsequently, whenever the query reconnects to the data source, these steps are automatically applied, ensuring consistent data shaping. Importantly, Power Query Editor modifies only a specific view of your data, preserving confidence in alterations made to the original data source. The steps taken are visible on the right side of the screen in the Query Settings pane, alongside the query's properties.
Identifying column headers and names
To initiate the structuring of your raw data, start by recognizing the column headers and names within the dataset. Assess their positions to confirm they are correctly placed. In the provided screenshot, the CSV file source data for SalesTarget (actual sample not provided) exhibits a target categorized by products and a subcategory divided by months, systematically arranged into columns.


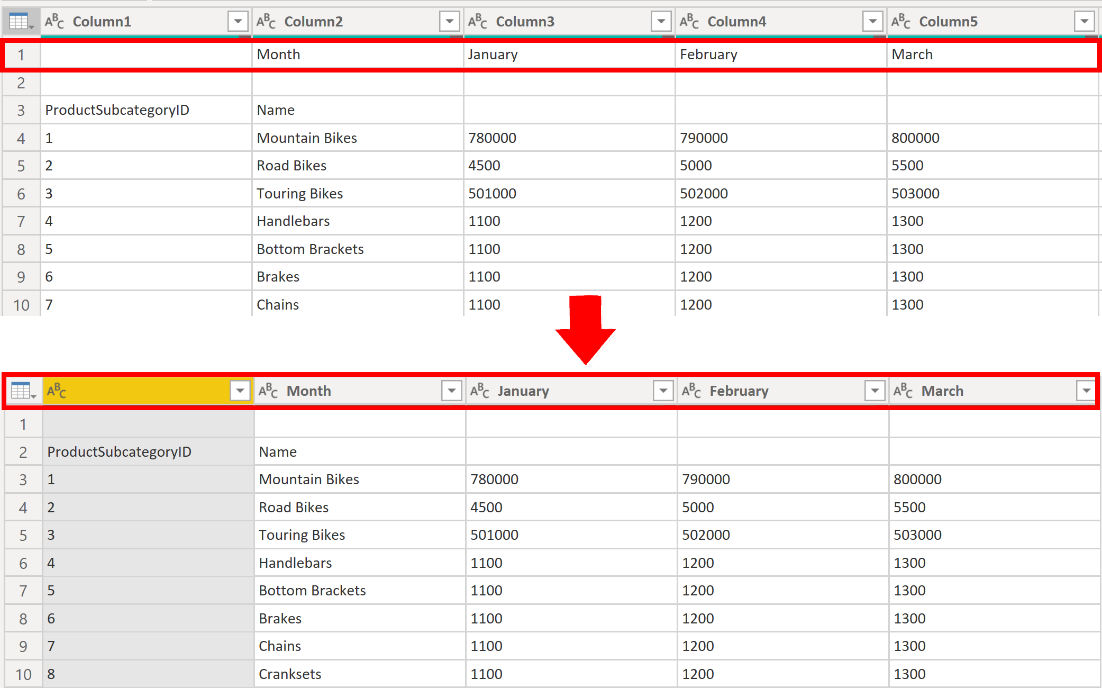
As a result, comprehending the data poses a challenge. The existing data faces an issue where column headers are spread across various rows (highlighted in red), and numerous columns bear non-descriptive names like Column1, Column2, and so forth.
Once you pinpoint the locations of the column headers and names, you have the ability to implement alterations to rearrange the data.
Promote headers
In Power BI Desktop, when a table is generated, Power Query Editor initially treats all data as table rows. Yet, certain data sources may feature a first row containing column names, as observed in the previous SalesTarget scenario. To rectify this discrepancy, you must elevate the initial table row to serve as column headers.
There are two methods to promote headers: you can either choose the Use First Row as Headers option on the Home tab or opt for the drop-down button next to Column1, selecting Use First Row as Headers.

Rename columns
To refine your data further, inspect the column headers for potential issues like incorrect labels, spelling errors, or inconsistent naming conventions.
Review the prior screenshot illustrating the impact of the "Use First Row as Headers" feature. It reveals an example where the subcategory Name column incorrectly bears the header "Month." This mislabeling requires correction through a renaming process.
Column headers can be renamed in two ways: right-click the header, choose Rename, modify the name, and press Enter; or double-click the column header, replacing the name with the correct one.
An alternative approach involves skipping the first two rows to address the issue. By doing so, you can subsequently rename the columns to rectify any inaccuracies.
Remove top rows
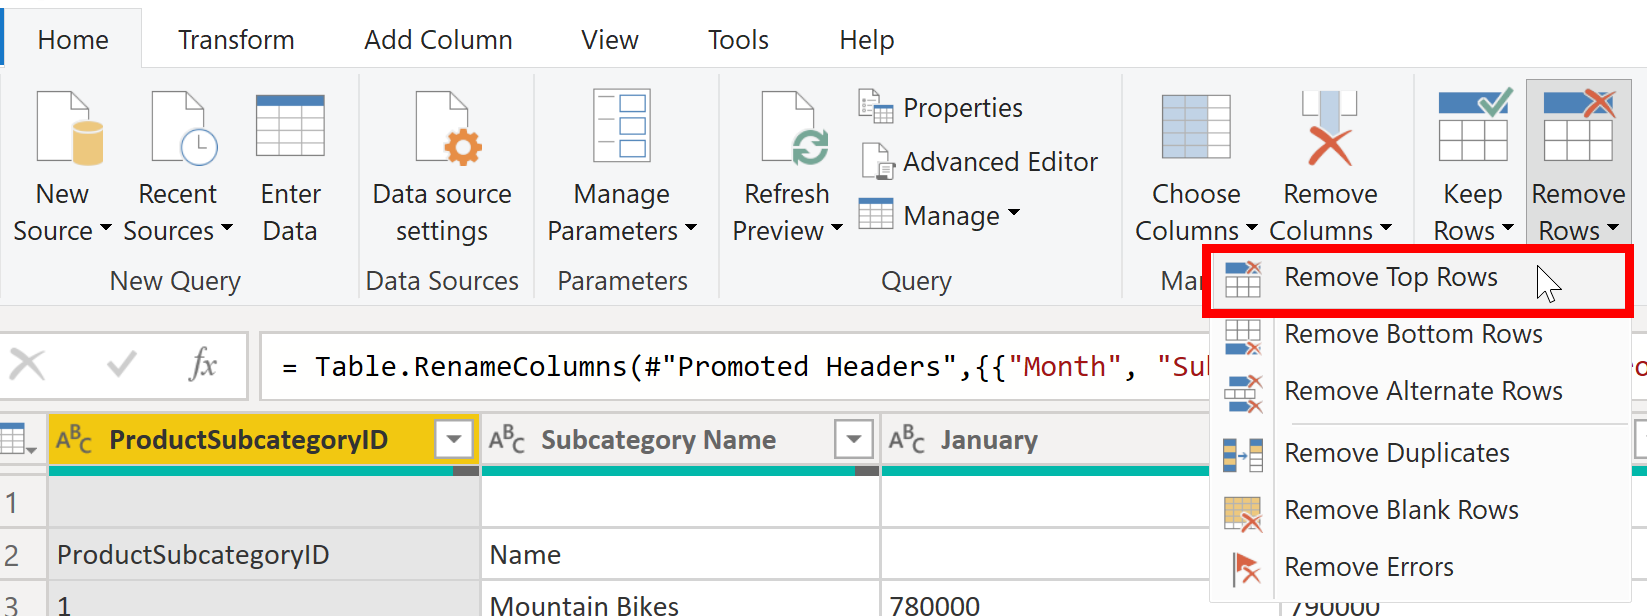
During the data shaping process, you may find it necessary to eliminate specific top rows, such as those containing blank entries or irrelevant data for your reports.
In the given SalesTarget instance, observe that the initial row is devoid of any data (blank), and the subsequent row contains information that is no longer pertinent.

Remove columns
An essential step in shaping data involves eliminating unnecessary columns, a task best performed early in the process. When acquiring data from a source, particularly in scenarios like extracting from a relational database using SQL, it's advisable to limit columns during the extraction by specifying a column list in the SELECT statement.
Early removal of columns proves advantageous, especially when dealing with established relationships between tables. This practice aids in focusing on pertinent data, enhancing the overall performance of Power BI Desktop semantic models and reports.
To decide whether a column is necessary, assess its data relevance for your intended reports. If a column doesn't contribute to your semantic model's value and won't be utilized in a report, it's prudent to remove it. Columns can be added later if requirements evolve.
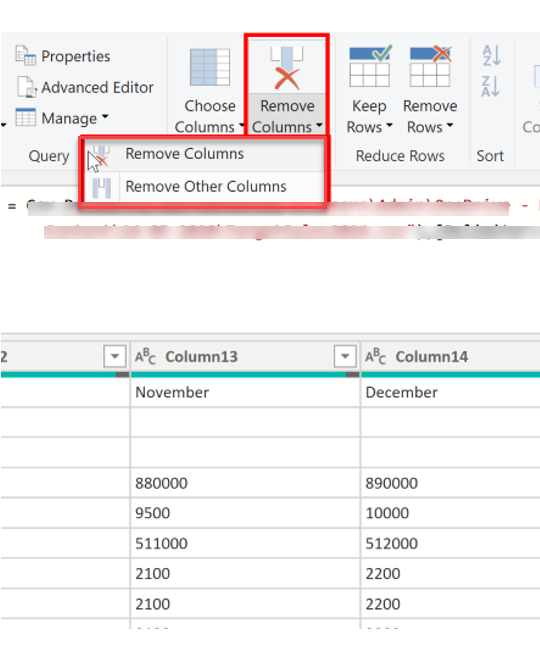
Two methods exist for column removal. The initial approach involves selecting the desired columns and choosing "Remove Columns" on the Home tab.
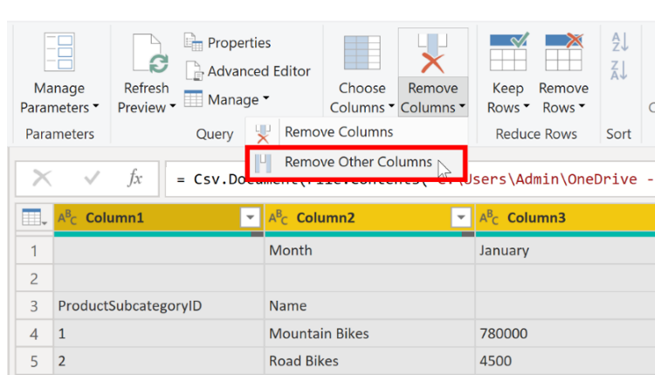
Alternatively, you can select the columns that you want to keep and then, on the Home tab, select Remove Columns > Remove Other Columns.
Unpivot columns
The unpivoting functionality in Power BI proves valuable, and applicable across various data sources, though it finds frequent use during the import of Excel data. This feature becomes especially handy when dealing with a sample Excel document containing sales data.
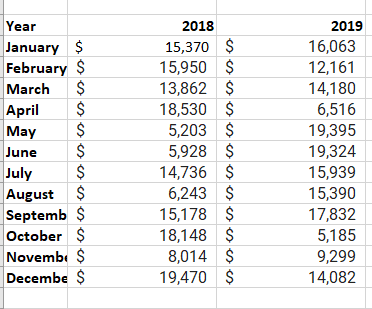
Though the data might initially make sense, it would be difficult to create a total of all sales combined from 2018 and 2019. Your goal would then be to use this data in Power BI with three columns: Month, Year, and SalesAmount.
When you import the data into Power Query, it will look like the following image.
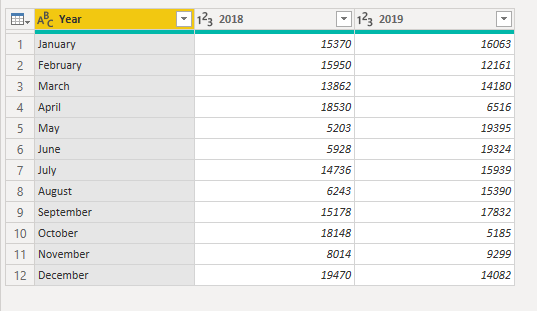
Next, rename the first column to Month. This column was mislabeled because that header in Excel was labeling the 2018 and 2019 columns. Highlight the 2018 and 2019 columns, select the Transform tab in Power Query, and then select Unpivot.
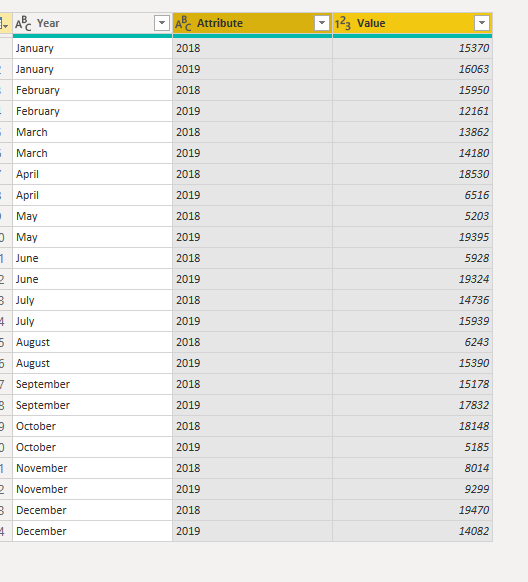
You can rename the Attribute column to Year and the Value column to SalesAmount.
Unpivoting streamlines the process of creating DAX measures on the data later. By completing this process, you have now created a simpler way of slicing the data with the Year and Month columns.
Pivot column
When dealing with flat and unstructured data, it becomes challenging to discern patterns within the details. To enhance clarity and analysis, the Pivot Column feature proves invaluable.
This feature allows the transformation of flat data into a structured table, offering an aggregated value for each unique entry in a specific column. Its versatility shines as it enables summarization using various mathematical functions like Count, Minimum, Maximum, Median, Average, or Sum.
In the context of the SalesTarget example, employing the Pivot Column feature facilitates the pivoting of columns to reveal the quantity of product subcategories within each product category.
On the Transform tab, select Transform > Pivot Columns.

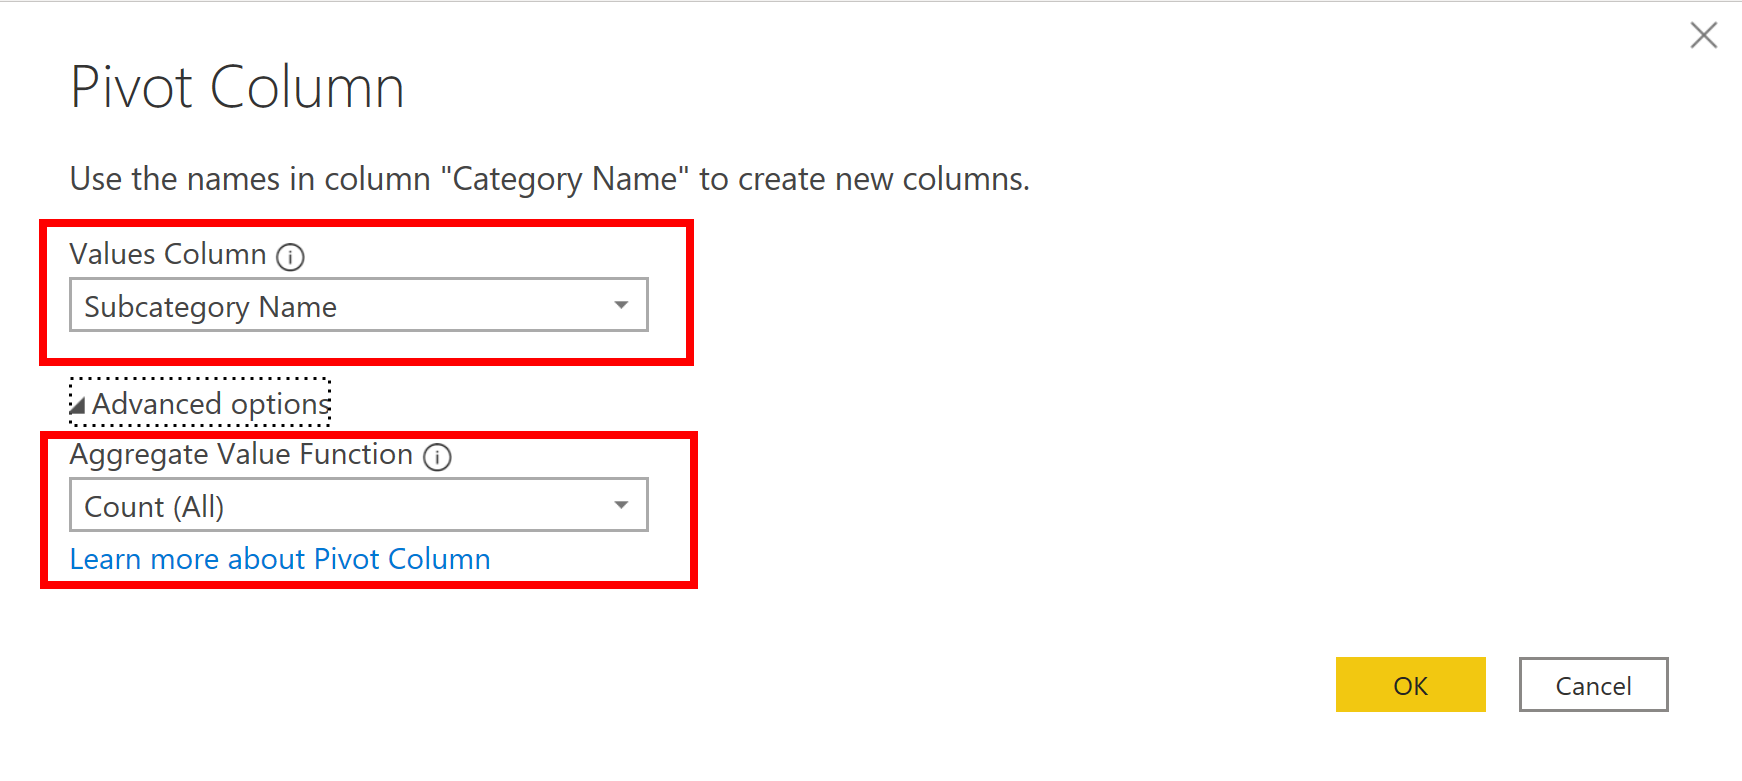
On the Pivot Column window that displays, select a column from the Values Column list, such as Subcategory name. Expand the advanced options and select an option from the Aggregate Value Function list, such as Count (All), and then select OK.

Power Query Editor records all steps that you take to shape your data, and the list of steps are shown in the Query Settings pane. If you have made all the required changes, select Close & Apply to close Power Query Editor and apply your changes to your semantic model. However, before you select Close & Apply, you can take further steps to clean up and transform your data in Power Query Editor.
SWETA SARANGI
22.02.2024
