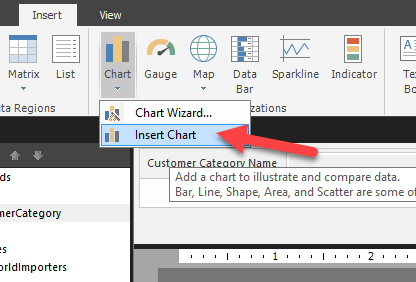
Two ways to add a chart to your report are: Select the Chart button, select Insert Chart, and then draw your table on the canvas.
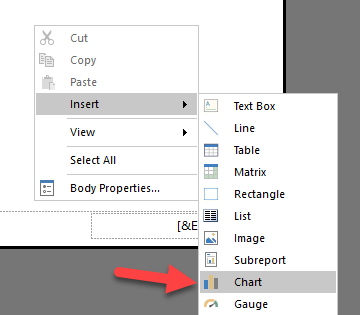
Right-click the report canvas, select Insert, and then select Chart.
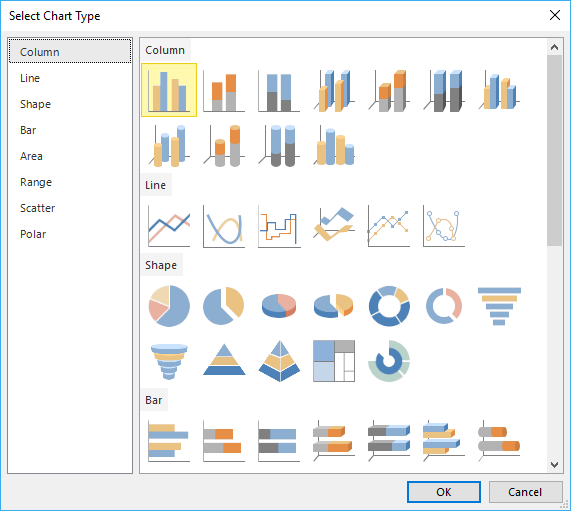
Next, choose the type and style of your chart.
After you have selected a chart type, the chart will be added to the design surface.
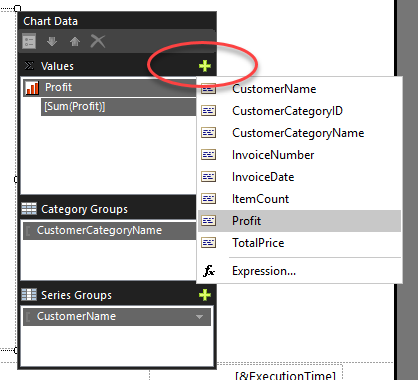
When you select the chart, a new window appears to the right. The Chart Data screen allows you to format the chart according to the values and axis properties.
Select the plus (+) sign beside each section to select the required columns.
Reference: Microsoft PL-300 Certified Learning Path


