Create a date table in PowerBI

When creating reports in Power BI, a frequent business need involves performing calculations based on date and time for insights into business performance across months, quarters, fiscal years, etc. Ensuring accurate formatting of time-oriented values is crucial for meaningful analyses. While Power BI automatically identifies date columns and tables, there are instances where additional steps are necessary to align dates with the organization's format requirements.
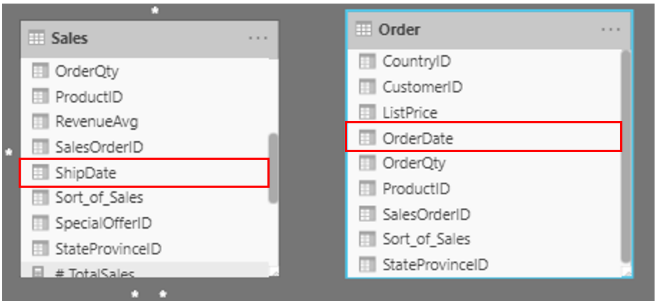
For instance, consider a scenario where you're crafting reports for the Sales team. The database comprises tables for sales, orders, products, etc. Notably, tables like Sales and Orders feature their own date columns, such as ShipDate and OrderDate. The challenge is to create a table showcasing total sales and orders by year and month. How can you visually represent data from multiple tables, each referencing its specific date columns?
To solve this problem, you can create a common date table that can be used by multiple tables. The following section explains how you can accomplish this task in Power BI.
Create a common date table
Ways that you can build a common date table are:
Source data
DAX
Power Query
Source Data
In some instances, databases and data warehouses may already possess dedicated date tables. If the database designer diligently structured these tables, they can serve various functions:
Identifying company holidays
Distinguishing between calendar and fiscal years
Recognizing weekends versus weekdays
When such source data tables are well-established and ready for use, it's advisable to directly incorporate them into your semantic model. Avoid employing alternative methods outlined in this context. Utilizing a source date table is recommended, especially if it's shared with other tools beyond Power BI.
However, if a source date table is unavailable, alternative approaches can be employed to construct a standardized date table.
DAX
To construct a common date table in Power BI, leverage the Data Analysis Expression (DAX) functions CALENDARAUTO() or CALENDAR(). The CALENDAR() function generates a sequential date range based on user-defined start and end dates. Conversely, CALENDARAUTO() automatically determines a contiguous date range from your semantic model. The starting date is set as the earliest date in your model, and the ending date is the latest, extended to the fiscal month if specified in the CALENDARAUTO() function.
For this example, CALENDAR() is chosen to display data from May 31, 2011 (the inception of Sales data tracking) onward for the next decade.
In Power BI Desktop:
Select "New Table."
Input the following DAX formula:
DAXCopy codeYourTableName = CALENDAR(DATE(2011, 5, 31), DATE(2021, 5, 31))
Replace "YourTableName" with the desired name for your new table.
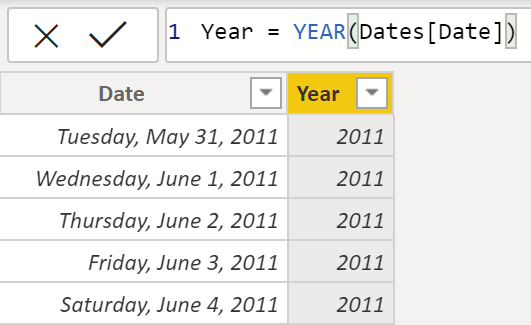
Now, you have a column of dates that you can use. However, this column is slightly sparse. You also want to see columns for just the year, the month number, the week of the year, and the day of the week. You can accomplish this task by selecting New Column on the ribbon and entering the following DAX equation, which will retrieve the year from your Date table.
DAXCopy
Year = YEAR(Dates[Date])
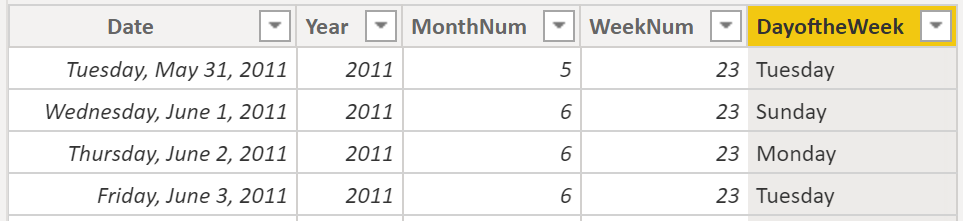
You can perform the same process to retrieve the month number, week number, and day of the week:
DAXCopy
MonthNum = MONTH(Dates[Date])
DAXCopy
WeekNum = WEEKNUM(Dates[Date])
DAXCopy
DayoftheWeek = FORMAT(Dates[Date], "DDDD")
When you have finished, your table will contain the columns that are shown in the following figure.
You have now created a common date table by using DAX. This process only adds your new table to the semantic model; you will still need to establish relationships between your date table and the Sales and Order tables, and then mark your table as the official date table of your semantic model. However, before you complete those tasks, make sure that you consider another way of building a common date table: by using Power Query.
Power Query
You can use M-language, the development language that is used to build queries in Power Query, to define a common date table.
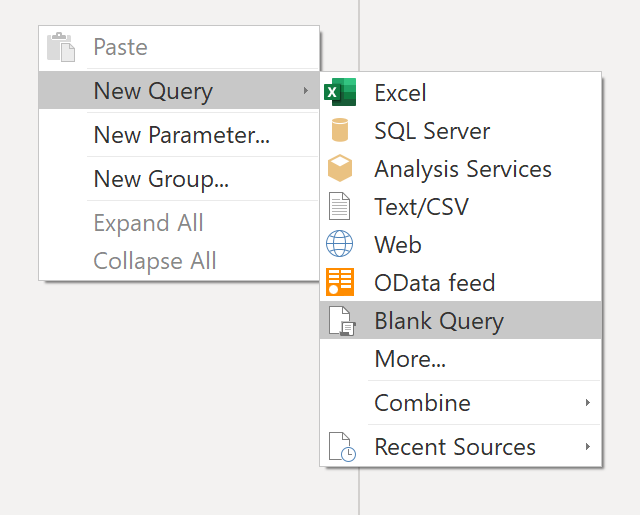
Select Transform Data in Power BI Desktop, which will direct you to Power Query. In the blank space of the left Queries pane, right-click to open the following drop-down menu, where you will select New Query > Blank Query.
In the resulting New Query view, enter the following M-formula to build a calendar table:
MCopy
= List.Dates(#date(2011,05,31), 365*10, #duration(1,0,0,0))

For your sales data, you want the start date to reflect the earliest date that you have in your data: May 31, 2011. Additionally, you want to see dates for the next 10 years, including dates in the future. This approach ensures that, as new sales data flows in, you won't have to re-create this table. You can also change duration. In this case, you want a data point for every day, but you can also increment by hours, minutes, and seconds. The following figure shows the result.

After you have realized success in the process, you notice that you have a list of dates instead of a table of dates. To correct this error, go to the Transform tab on the ribbon and select Convert > To Table. As the name suggests, this feature will convert your list into a table. You can also rename the column to DateCol.

Next, you want to add columns to your new table to see dates in terms of year, month, week, and day so that you can build a hierarchy in your visual. Your first task is to change the column type by selecting the icon next to the name of the column and, in the resulting drop-down menu, selecting the Date type.

After you have finished selecting the Date type, you can add columns for year, months, weeks, and days. Go to Add Column, select the drop-down menu under Date, and then select Year, as shown in the following figure.

Notice that Power BI has added a column of all years that are pulled from DateCol.

Complete the same process for months, weeks, and days. After you have finished this process, the table will contain the columns that are shown in the following figure.

You have now successfully used Power Query to build a common date table.
The previous steps show how to get the table into the semantic model. Now, you need to mark your table as the official date table so that Power BI can recognize it for all future values and ensure that formatting is correct.
Mark as the official date table
Your first task in marking your table as the official date table is to find the new table on the Fields pane. Right-click the name of the table and then select Mark as date table, as shown in the following figure.

By marking your table as a date table, Power BI performs validations to ensure that the data contains zero null values, is unique, and contains continuous date values over a period. You can also choose specific columns in your table to mark as the date, which can be useful when you have many columns within your table. Right-click the table, select Mark as date table, and then select Date table settings. The following window will appear, where you can choose which column should be marked as Date.

Selecting Mark as date table will remove autogenerated hierarchies from the Date field in the table that you marked as a date table. For other date fields, the auto hierarchy will still be present until you establish a relationship between that field and the date table or until you turn off the Auto Date/Time feature. You can manually add a hierarchy to your common date table by right-clicking the year, month, week, or day columns in the Fields pane and then selecting New hierarchy. This process is further discussed later in this module.
Build your visual
To build your visual between the Sales and Orders tables, you will need to establish a relationship between this new common date table and the Sales and Orders tables. As a result, you will be able to build visuals by using the new date table. To complete this task, go to Model tab \> Manage Relationships, where you can create relationships between the common date table and the Orders and Sales tables by using the OrderDate column. The following screenshot shows an example of one such relationship.

After you have built the relationships, you can build your Total Sales and Order Quantity by Time visual with your common date table that you developed by using the DAX or Power Query method.
To determine the total sales, you need to add all sales because the Amount column in the Sales table only looks at the revenue for each sale, not the total sales revenue. You can complete this task by using the following measure calculation, which will be explained in later discussions. The calculation that you will use when building this measure is as follows:
DAXCopy
#Total Sales = SUM(Sales[‘Amount’])
After you have finished, you can create a table by returning to the Visualizations tab and selecting the Table visual. You want to see the total orders and sales by year and month, so you only want to include the Year and Month columns from your date table, the OrderQty column, and the #TotalSales measure. When you learn about hierarchies, you can also build a hierarchy that will allow you drill down from years to months. For this example, you can view them side-by-side. You have now successfully created a visual with a common date table.

SWETA SARANGI
29.02.2024


