Create and configure a dashboard in PowerBI

Power BI dashboards are single-page visualizations created in the Power BI service by pinning visuals from reports.
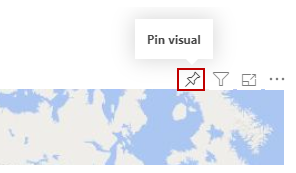
To add a visualization to a dashboard, you can "pin" it. This is like pinning a picture to a corkboard. To pin a visualization, open the report that contains the visualization in the Power BI service. Then, hover over the visualization you want to pin and click the pin icon.
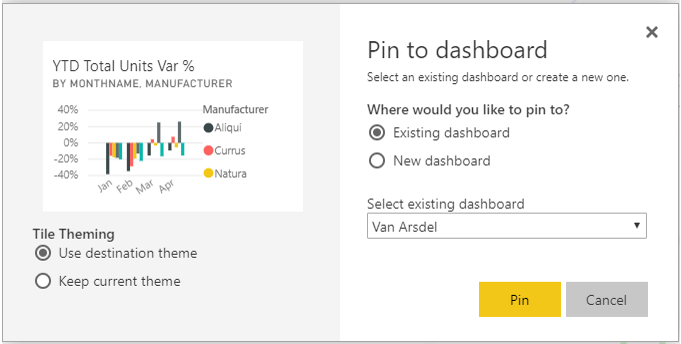
You can select a destination dashboard for the visual from the drop-down menu or create a new dashboard. You can pin visualizations from multiple reports and pages to a single dashboard, allowing you to combine different datasets and sources into a single page of insights.
Dashboards can be customized with visualizations, such as charts, maps, images, and shapes. These visualizations are called "tiles" after they have been pinned to a dashboard.
You can customize the layout of the visuals on a dashboard by resizing and moving them. To resize a tile, drag its edges. To move a tile, drag it to a new location. You can also change the title and subtitle of a tile by hovering over it and clicking the pencil icon.
SWETA SARANGI


