Data granularity refers to the depth of information conveyed in your dataset. It signifies that as the granularity increases, the dataset becomes more detailed.
This aspect of data granularity holds significance for data analysts irrespective of the specific Power BI tools employed. Accurately determining the appropriate data granularity plays a pivotal role in influencing the effectiveness and user-friendliness of Power BI reports and visuals.
Data granularity defined
Imagine overseeing a fleet of 1,000 refrigerated semi-trucks equipped with Microsoft Azure IoT applications that constantly log the temperature of each truck. This temperature data holds critical importance as a malfunction in refrigeration could lead to spoilage, resulting in substantial financial losses. Given the multitude of trucks and sensors, substantial data accumulates daily. However, report users find it inconvenient to sift through a vast number of records to locate specific information of interest.
What strategies can be employed to adjust the data granularity and enhance the usability of the semantic model?
In this situation, consider importing data by calculating the daily average temperature for each truck. This method minimizes database records to one per truck per day. If this level of detail suffices for cost and error tracking, it can be adopted as the data granularity. Alternatively, you may opt to import only the last recorded temperature or selectively bring in records exceeding or falling below a normal temperature range. Any of these approaches effectively reduce the overall number of imported records, ensuring comprehensive and valuable data.
In various situations, you can opt for weekly, monthly, or quarterly data granularity, aiming for fewer records to enhance report and visual performance. This strategy facilitates a quicker refresh rate for the overall semantic model, allowing more frequent updates.
However, this approach comes with a downside. If users require detailed exploration of individual transactions, summarizing granularity hinders such drill-down capabilities, potentially adversely affecting the user experience. Therefore, it's crucial to engage in discussions with report users to collectively determine the appropriate level of data granularity, ensuring a mutual understanding of the consequences of these decisions.
Change data granularity to build a relationship between two tables
Data granularity can also have an impact when you're building relationships between tables in Power BI.
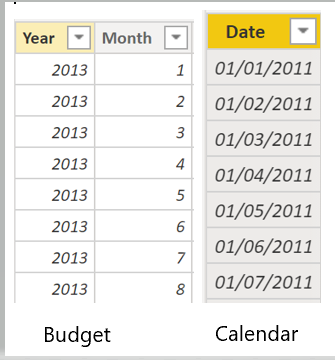
For example, consider that you're building reports for the Sales team at Tailwind Traders. You've been asked to build a matrix of total sales and budget over time by using the Calendar, Sales, and Budget tables. You notice that the lowest level of time-based detail that the Sales table goes into is by day, for instance 5/1/2020, 6/7/2020, and 6/18/2020. The Budget table only goes to the monthly level, for instance, the budget data is 5/2020 and 6/2020. These tables have different granularities that need to be reconciled before you can build a relationship between tables.
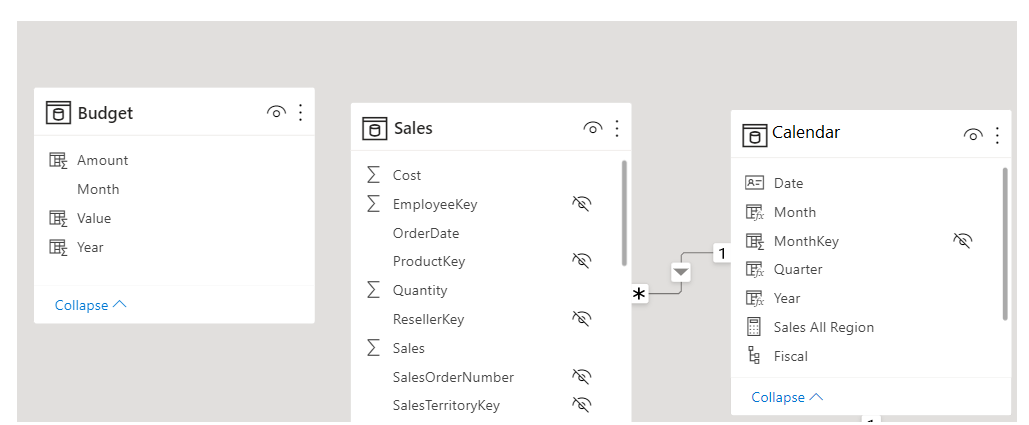
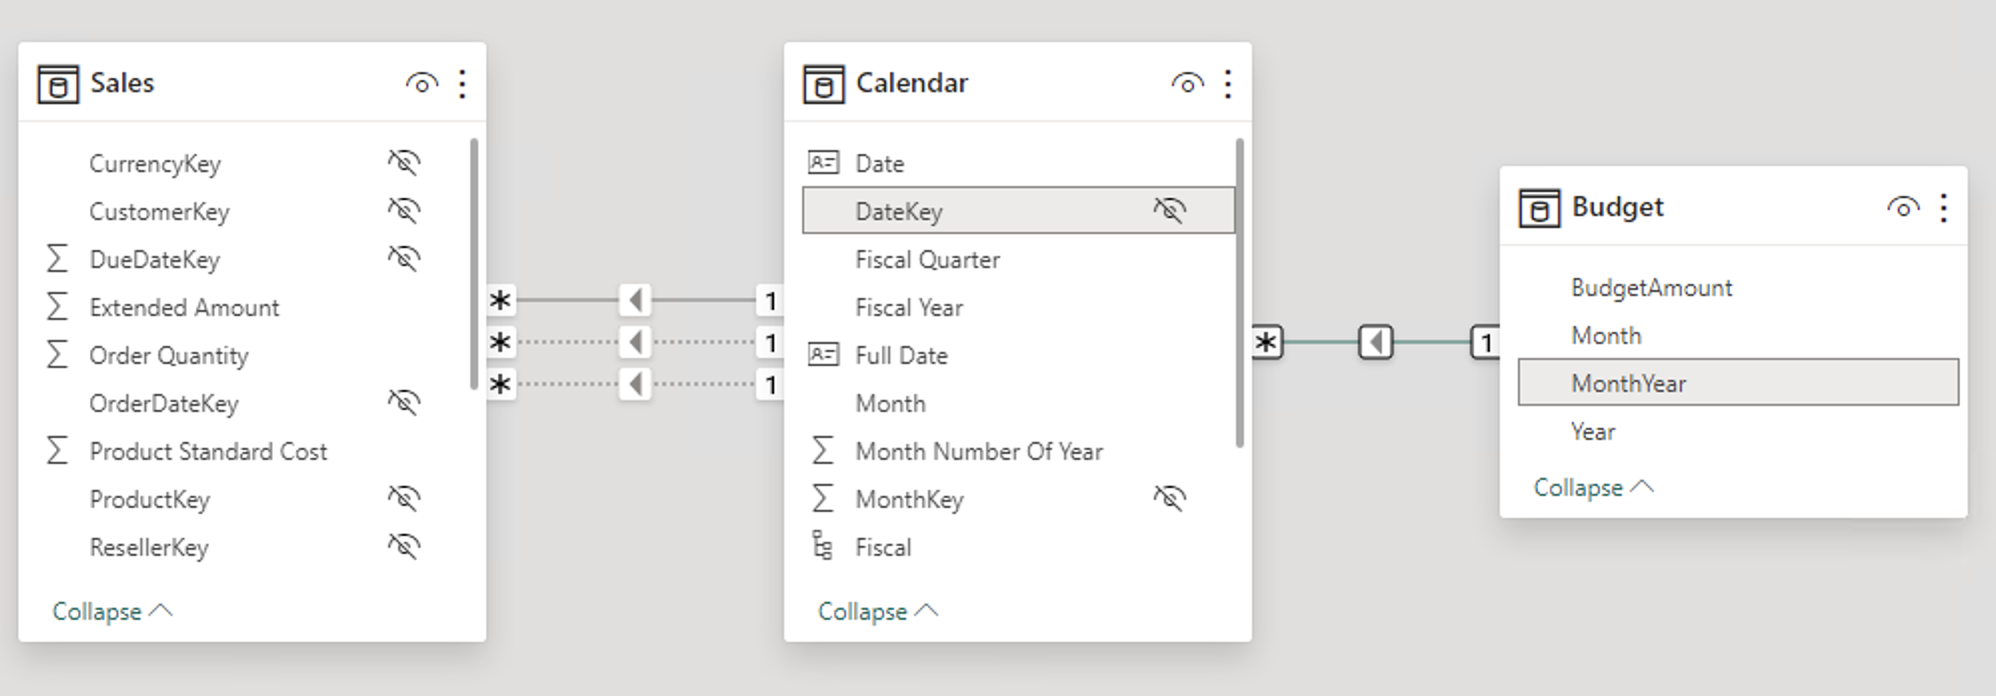
The following figure shows your current semantic model.
As shown in the preceding figure, a relationship between Budget and Calendar is missing. Therefore, you need to create this relationship before you can build your visual. Notice that if you transform the Year and Month columns in the Calendar table into a new column, and do the same transformation in the Budget table, you can match the format of the Date column in the Calendar table. Then, you can establish a relationship between the two columns. To complete this task, you'll concatenate the Year and Month columns and then change the format.
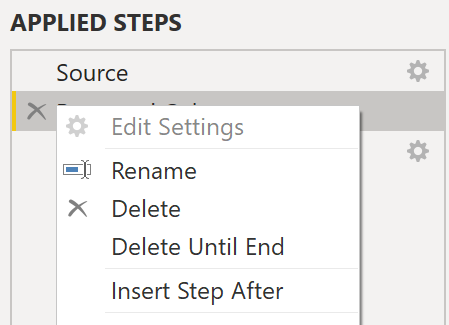
Select Transform Data on the ribbon. On Applied Steps, on the right pane, right-click the last step and then select Insert Step After.
Under Add Column on the Home ribbon, select Custom Column. Enter the following equation, which will concatenate the Year and Month columns, and then add a dash in between the column names.
MCopy
Column = Table.AddColumn(#"Renamed Columns", "Custom", each [Year] & "-" &[Month])
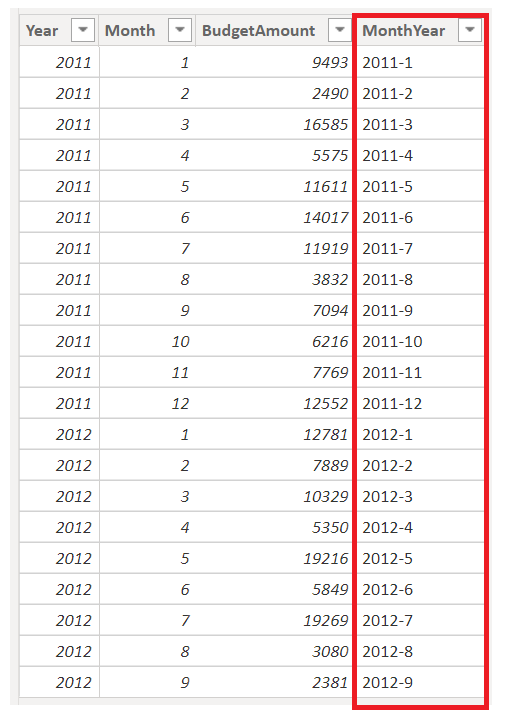
Change the data type to Date and then rename the column. Your Budget table should resemble the following figure.
Now, you can create a relationship between the Budget and the Calendar tables.
Create a relationship between tables
Power BI automatically detects relationships, but you can also go to Manage Relationships > New and create the relationship on the Date column. The relationship should resemble the following figure.
By completing this task, you've ensured that the granularity is the same between your different tables. Now, you need to create DAX measures to calculate Total Sales and BudgetAmount. Go to the Data pane on Power BI Desktop, select New Measure, and then create two measures with the following equations:
DAXCopy
TotalSales = SUM(Sales[Total Sales])
DAXCopy
BudgetAmount = SUM (Budget[BudgetAmount])
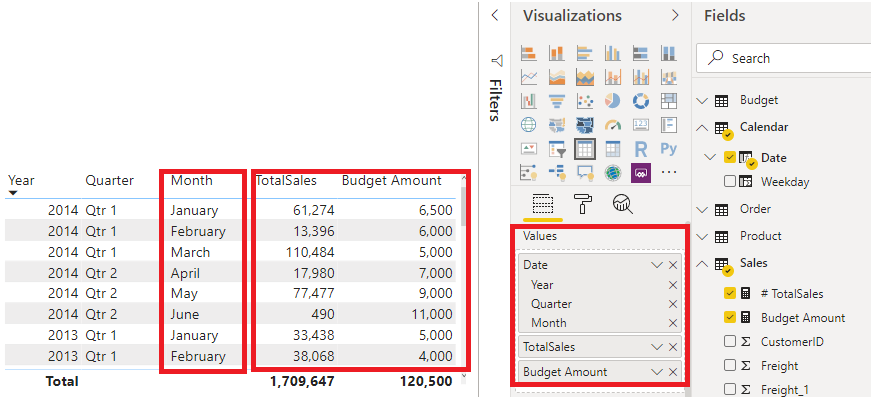
Select the table visual on the Visualization pane, and then enter these measures and the Date into the Values field. You've now accomplished the goal of building a matrix of the total sales and budgets over time.
SWETA SARANGI
01.03.2024

