Introduction to DAX

By using Data Analysis Expressions (DAX), you can add three types of calculations to your semantic model:
Calculated tables
Calculated columns
Measures
Calculated tables
Utilizing a DAX formula enables the incorporation of a calculated table into your model. This formula can replicate or modify existing model data or generate a new table through the creation of a data series. It's important to note that the data from calculated tables is consistently imported into the model, contributing to an expansion in model storage size and potentially extending the time required for data refresh.
Calculated tables can be useful in various scenarios:
Date tables
Role-playing dimensions
What-if analysis
Date tables
To implement specialized time filters, known as time intelligence, it's essential to have date tables. DAX time intelligence functions operate accurately only when a dedicated date table is established. In cases where the source data lacks a date table, you can create one using the CALENDAR or CALENDARAUTO DAX functions, treating them as calculated tables.
Role playing dimensions
If you observe multiple relationships between two model tables, it may indicate the presence of a role-playing dimension in your model. For instance, consider a Sales table featuring two date columns, OrderDateKey and ShipDateKey, both linked to the Date column in the Date table. In this scenario, the Date table is referred to as a role-playing dimension, as it can function as either the order date or ship date.
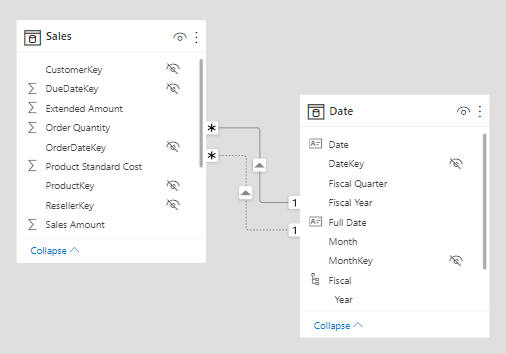
In Microsoft Power BI models, only one active relationship between tables is allowed, depicted by a solid line in the model diagram. The default active relationship filters data, like from the Date table to the OrderDateKey column in the Sales table. Any additional relationships between the tables are inactive, illustrated by dashed lines in the model diagram. Inactive relationships come into play only when explicitly invoked in a calculated formula using the USERELATIONSHIP DAX function.
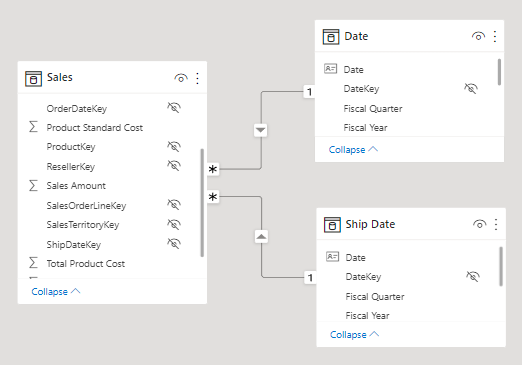
A more effective model design might involve two date tables, each establishing an active relationship with the Sales table. This allows report users to filter by order date, ship date, or both simultaneously. To achieve this, a calculated table can be employed to duplicate Date table data, creating a separate Ship Date table.
What-if parameters
In Power BI Desktop, the 'What-if parameters' feature facilitates the creation of calculated tables within your model. These parameters empower report users to pick or filter values stored in the calculated table. Measures can then incorporate these selected values in meaningful ways. For instance, a 'What-if parameter' might enable users to choose a hypothetical currency exchange rate, allowing a measure to divide revenue values (in a local currency) by the selected rate.
It's important to note that 'What-if' calculated tables don't establish relationships with other tables in the model because they don't participate in propagating filters. Due to this characteristic, they are often referred to as disconnected tables.
Calculated Columns
Using DAX, you can create a calculated column in any table within your Power BI model. The formula you write is assessed for each row in the table, producing a singular result. If applied to a table with Import storage mode, the formula is computed during the refresh of the semantic model, contributing to an increase in the model's storage size. Conversely, when implemented in a table with DirectQuery storage mode, the formula is executed by the source database when the table is queried.
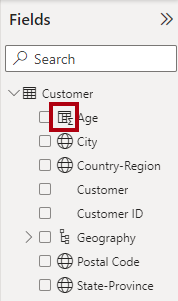
Calculated columns are easily identifiable in the Fields pane by a distinctive icon. As an illustration, the Customer table may contain a calculated column named Age.
Measures
Utilizing DAX, you have the ability to create a measure in any table within your Power BI model. The measure is designed for data summarization, akin to a calculated column, but it must produce a singular value. In contrast to calculated columns, which undergo evaluation during data refresh, measures are assessed dynamically at query time. Importantly, the results of measures are not stored within the model.
Measures are visually identified in the Fields pane by a distinctive calculator icon. For instance, the Sales table might feature three measures: Cost, Profit, and Revenue.
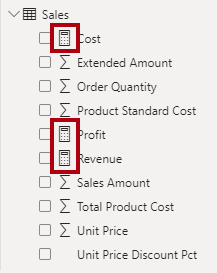
Occasionally, measures can be described as explicit measures. To be clear, explicit measures are model calculations that are written in DAX and are commonly referred to as simply measures. Yet, the concept of implicit measures exists, too. Implicit measures are columns that can be summarized by visuals in simplistic ways, like count, sum, minimum, maximum, and so on. You can identify implicit measures in the Fields pane because they're shown with the sigma symbol ( ∑ ).
Additionally, no such concept as a calculated measure exists in tabular modeling. The word calculated is used to describe calculated tables and calculated columns, which distinguishes them from tables and columns that originate from Power Query. Power Query doesn't have the concept of an explicit measure.
SWETA SARANGI
03.03.2024


