Cardinality refers to the uniqueness of the values within a column and is also used to describe the direction of relationships between two tables.
Identify Cardinality Levels in Columns
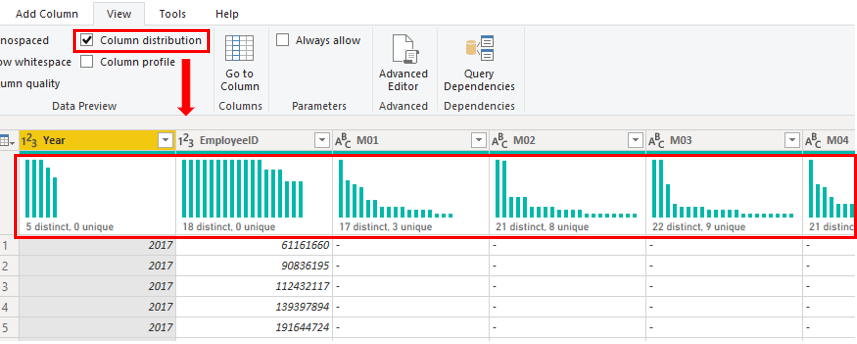
When analyzing metadata using Power Query Editor, the Column distribution option on the View tab provides statistics on the distinct and unique items in each column.
Distinct values count: The total number of different values found in a column.
Unique values count: The total number of values that appear only once in a column.

A column that has a lot of repeated values in its range (unique count is low) will have a low level of cardinality. Conversely, a column that has a lot of unique values in its range (unique count is high) will have a high level of cardinality.
Lower cardinality leads to more optimized performance, so you might need to reduce the number of high cardinally columns in your semantic model.
Reduce relationship cardinality
When you import multiple tables, you might analyze data from all those tables. Relationships between these tables are necessary for accurate calculations and correct information display in your reports. Power BI Desktop simplifies the creation of these relationships. Often, the autodetect feature handles this automatically, but sometimes you may need to create or adjust relationships manually. Understanding how to create and edit relationships in Power BI Desktop is crucial.
When you create or edit a relationship, you can configure additional options. By default, Power BI Desktop automatically sets these options based on the data in the columns, which can vary for each relationship.
Relationships have different cardinality types, which define the direction and nature of the relationship. Each relationship in your model must have a defined cardinality type:
Many-to-one (*:1): This is the most common and default type, where one table can have multiple instances of a value, while the related lookup table has only one instance of that value.
One-to-one (1:1): Both tables have only one instance of each value.
One-to-many (1:*): One table has a single instance of a value, while the related table can have multiple instances.
Many-to-many (:*): With composite models, this type allows for relationships without unique values in tables, eliminating the need for workaround tables.
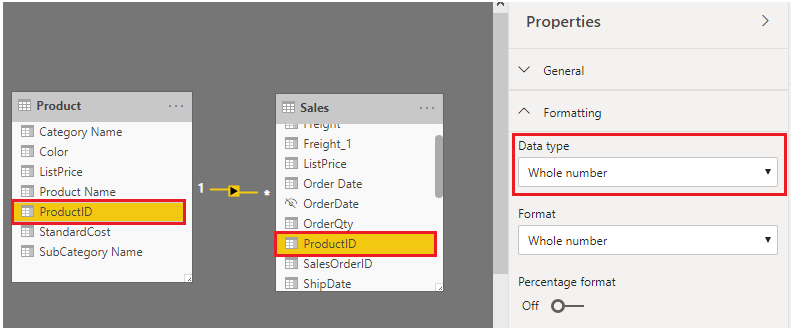
When developing your model and creating relationships, ensure that both columns involved share the same data type. A relationship won't work if one column is text and the other is an integer.
For example, in the Product and Sales tables, the ProductID field has the data type Whole number. Columns with an Integer data type perform better than those with a Text data type.

Improve performance by reducing cardinality levels
Power BI Desktop provides various techniques to reduce the data loaded into semantic models, such as summarization. Reducing data improves the relationship cardinality of the report, so it's important to minimize the data in your models. This is especially true for large models or those expected to grow significantly over time.
One of the most effective ways to reduce model size is by using a summary table from the data source. While a detail table might include every transaction, a summary table aggregates data, showing one record per day, week, or month—such as the daily average of transactions.
For example, a source sales fact table that stores one row per order line can be significantly reduced by summarizing sales metrics grouped by date, customer, and product, provided that individual transaction details are not needed.
Even greater data reduction can be achieved by grouping data at the month level, potentially reducing model size by up to 99%. However, this means you can no longer report at the day level or on individual orders. Summarizing fact-type data involves a tradeoff between data detail and model size. You might lose the ability to drill into detailed data because it's no longer available. This trade-off can be mitigated by using a mixed-model design.
In Power BI Desktop, a mixed-mode design creates a composite model, allowing you to set the storage mode for each table. Each table's Storage Mode property can be set to Import or DirectQuery.
A useful technique to reduce model size is setting the Storage Mode property of larger fact-type tables to DirectQuery. This approach works well with data summarization techniques. For instance, summarized sales data can be used for high-performance "summary" reporting, while a drill-through page can display granular sales for specific, narrow filter contexts using visuals based on a DirectQuery table to retrieve detailed sales order data.
SWETA SARANGI
12-06-2024
