Review performance of measures, relationships, and visuals in PowerBI

Photo by Nick Morrison on Unsplash
If your semantic model includes multiple tables, complex relationships, intricate calculations, numerous visuals, or redundant data, it can lead to poor report performance. This poor performance negatively impacts the user experience.
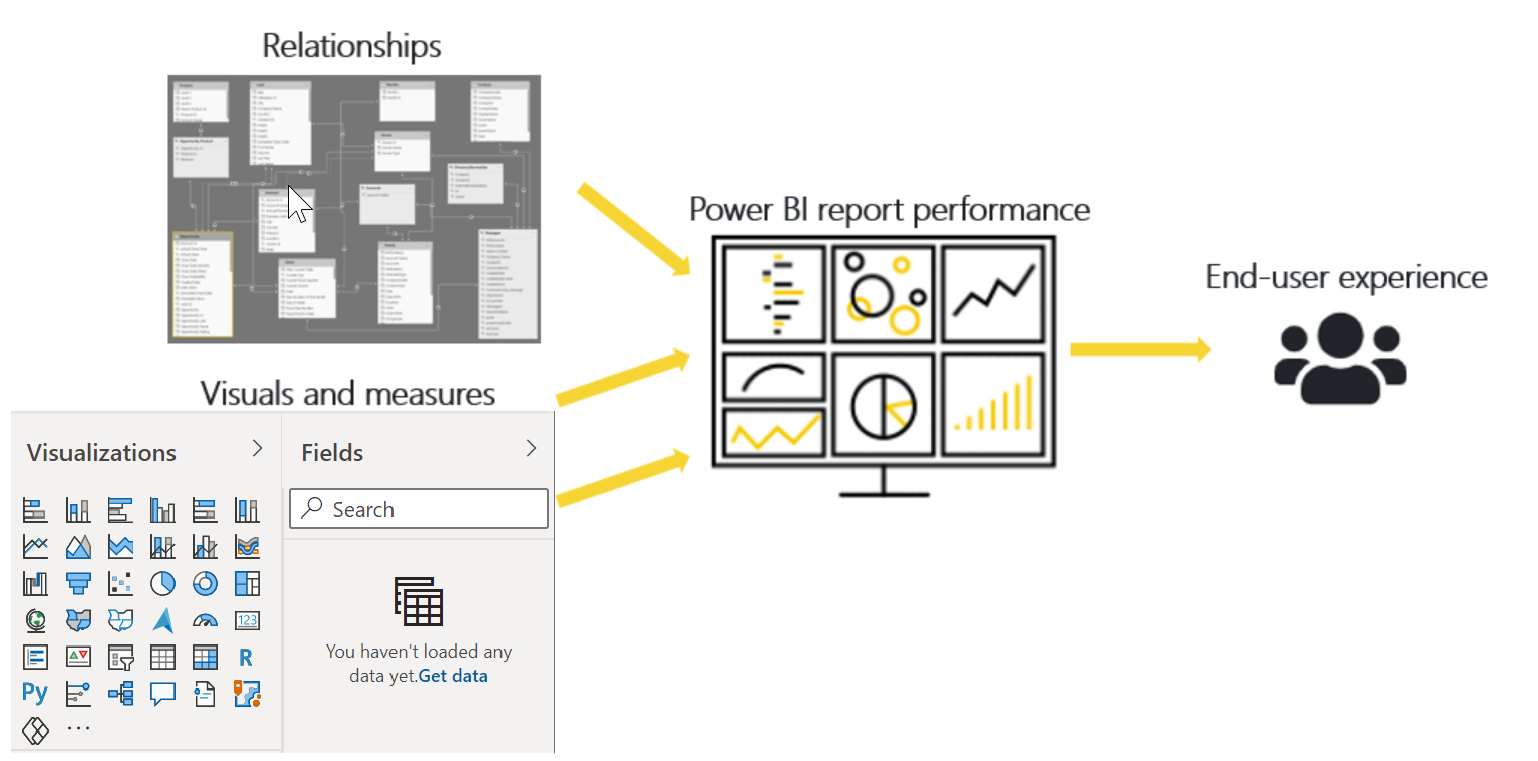
To optimize performance, you need to pinpoint the source of the problem—specifically, determine which elements of your report and semantic model are causing performance issues. Once identified, you can take steps to address these issues and enhance performance.
Identify report performance bottlenecks
To achieve optimal report performance, you need to develop an efficient semantic model with fast-running queries and measures. With a strong foundation, you can further enhance the model by analyzing query plans and dependencies and making necessary adjustments to optimize performance.
Review the measures and queries in your semantic model to ensure you're using the most efficient methods to obtain your desired results. Start by identifying bottlenecks in the code. By pinpointing the slowest query in the semantic model, you can address the biggest bottleneck first and create a priority list to resolve other issues systematically.
Analyze performance
You can use the Performance Analyzer in Power BI Desktop to evaluate how each report element performs during user interactions. For instance, it can show you the time it takes for a particular visual to refresh following user input. The Performance Analyzer helps identify which elements are causing performance issues, aiding in troubleshooting.
To ensure accurate analysis results, start with a clear visual cache and data engine cache.
Visual cache: When a visual is loaded, its cache cannot be cleared without restarting Power BI Desktop. To avoid caching, begin your analysis with a clean visual cache. To do this, add a blank page to your Power BI Desktop (.pbix) file, select that page, save and close the file, then reopen it. It will open on the blank page.
Data engine cache: Query results are cached, which can lead to misleading analysis results. Clear the data cache before rerunning the visual. You can clear the data cache by either restarting Power BI Desktop or using DAX Studio to connect to the semantic model and call Clear Cache.
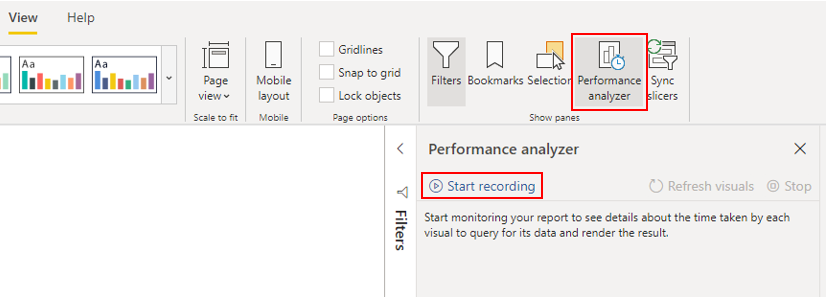
After clearing the caches and opening the Power BI Desktop file on the blank page, navigate to the View tab and select Performance Analyzer.
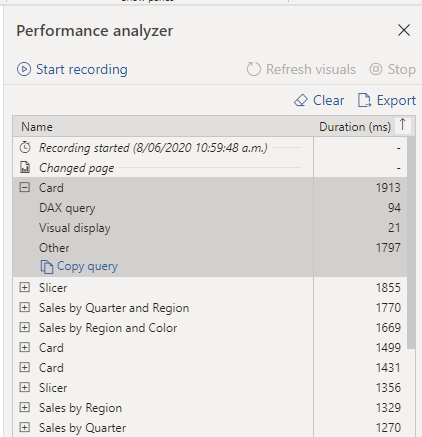
To start the analysis, click on Start Recording, then switch to the report page you want to analyze and interact with the report elements you wish to measure. The results of your interactions will appear in the Performance Analyzer pane. When you are done, click the Stop button.
Review results
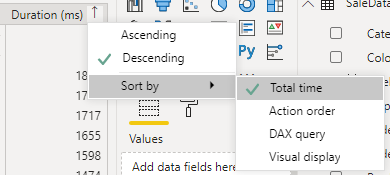
You can review the results of your performance test in the Performance Analyzer pane. To sort tasks by duration from longest to shortest, right-click the Sort icon next to the Duration (ms) column header and select Total time in Descending order. The log information for each visual includes the time taken (duration) for the following task categories:
DAX query: The time taken for the visual to send the query and for Analysis Services to return the results.
Visual display: The time taken for the visual to render on the screen, including time needed to retrieve web images or geocoding.
Other: The time taken for the visual to prepare queries, wait for other visuals to complete, or perform other background processing tasks. If this category shows a long duration, the only effective ways to reduce it are by optimizing DAX queries for other visuals or reducing the number of visuals in the report.
The analysis test results help you understand your semantic model's behavior and identify the elements that need optimization. By comparing the duration of each report element, you can pinpoint those with long durations and investigate why they take so long to load on the report page.
For a more detailed query analysis, you can use DAX Studio, a free, open-source tool provided by an external service.
Resolve issues and optimize performance
The analysis results will highlight areas that need improvement and opportunities for optimizing performance. You may discover the need for enhancements to visuals, DAX queries, or other elements in your semantic model. The following guidance outlines what to focus on and the adjustments you can implement.
Visuals
If you pinpoint visuals as the bottleneck causing poor performance, aim to enhance performance while minimizing the impact on user experience.
Evaluate the number of visuals on the report page; fewer visuals generally result in better performance. Consider whether a visual is truly necessary and if it adds value to the end user. If not, remove it. Instead of relying on multiple visuals, explore alternative methods to provide additional details, such as drill-through pages and report page tooltips.
Assess the number of fields in each visual. Having numerous visuals can increase the likelihood of performance issues and may make the report appear cluttered, reducing clarity. Keep in mind that visuals with more than 100 fields (measures or columns) will load slowly. Consider whether all this data is essential in a visual and explore reducing the number of fields used.
DAX Query
When you review the outcomes in the Performance Analyzer section, you can observe the duration it took for the Power BI Desktop engine to assess each query (in milliseconds). It's advisable to start with any DAX query that exceeds 120 milliseconds. In a given scenario, you may pinpoint a specific query with a significantly long duration.
The Performance Analyzer indicates potential concerns without specifying how to enhance them. It's recommended to delve deeper into why a particular measure takes considerable time to process. Utilizing DAX Studio can assist in this investigation.
For instance, you can click on "Copy Query" to transfer the calculation formula to the clipboard, then paste it into DAX Studio. This allows for a more thorough review of the calculation process. In the provided example, the aim is to count the total products with order quantities equal to or greater than five.
Semantic Model
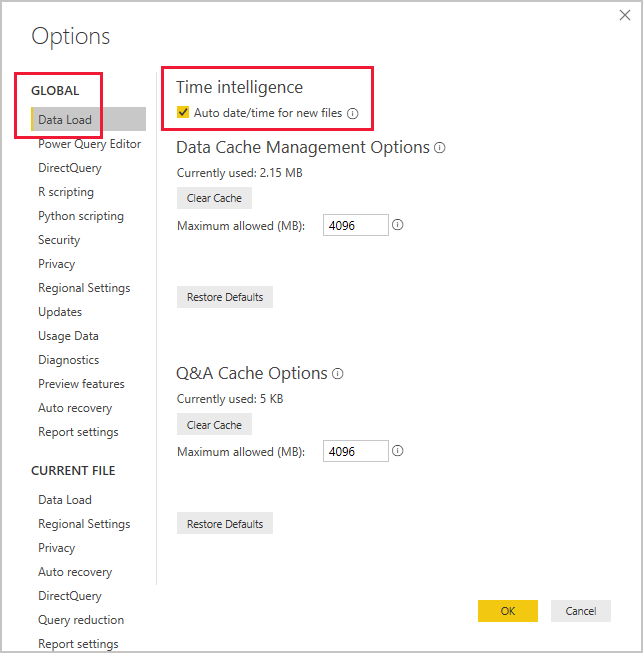
If the measures and visuals show minimal duration times, indicating quick processing, they're probably not causing performance problems. Conversely, a high duration value in a DAX query likely points to poorly written measures or problems in the semantic model. These issues could stem from relationships, columns, metadata in the model, or even the status of the Auto date/time option.
Relationships
Take time to examine the relationships among your tables to confirm they're set up correctly. Verify that the relationship cardinality properties are configured accurately. For instance, a column on the one side that holds unique values might be mistakenly set up as a many-side column. You'll gain a deeper understanding of how cardinality impacts performance in the upcoming module.
Columns
It's considered best practice to avoid importing unnecessary data columns. To prevent the need for deleting columns within Power Query Editor, it's preferable to address them at the data source when loading data into Power BI Desktop. However, if it's not possible to eliminate redundant columns from the source query or if the data has already been imported as is, you can use Power Query Editor to review each column. Evaluate whether each column is truly necessary and identify the value it contributes to your semantic model. If a column doesn't add value, it should be removed from the model.
For instance, imagine you have an ID column with thousands of unique rows that won't be used in any relationship or report. In such cases, considering this column as unnecessary acknowledges that it's taking up space in your semantic model.
Removing unnecessary columns reduces the semantic model's size, leading to smaller file sizes and quicker refresh times. Additionally, focusing on relevant data in the semantic model enhances overall report performance.
Metadata
Metadata refers to data about other data. In Power BI, metadata encompasses details about your semantic model, including column names, data types, formatting, database schema, report design, last modification date of files, data refresh frequencies, and various other attributes.
When importing data into Power BI Desktop, it's wise to analyze the associated metadata. This helps in spotting any inconsistencies within your semantic model and allows you to normalize the data before constructing reports. Analyzing metadata enhances semantic model performance by helping you identify unnecessary columns, data errors, incorrect data types, data volume (large semantic models, especially those with transactional or historical data, take longer to load), and more.
The Power Query Editor in Power BI Desktop enables you to scrutinize the raw data's columns, rows, and values. You can then utilize the tools provided, such as those illustrated in the screenshot below, to implement necessary modifications.
The Power Query options include:
Unnecessary columns - Evaluates the need for each column. If one or more columns will not be used in the report and are therefore unnecessary, you should remove them by using the Remove Columns option on the Home tab.
Unnecessary rows - Checks the first few rows in the semantic model to see if they are empty or if they contain data that you do not need in your reports; if so, it removes those rows by using the Remove Rows option on the Home tab.
Data type - Evaluates the column data types to ensure that each one is correct. If you identify a data type that is incorrect, change it by selecting the column, selecting Data Type on the Transform tab, and then selecting the correct data type from the list.
Query names - Examines the query (table) names in the Queries pane. Just like you did for column header names, you should change uncommon or unhelpful query names to names that are more obvious or names that the user is more familiar with. You can rename a query by right-clicking that query, selecting Rename, editing the name as required, and then pressing Enter.
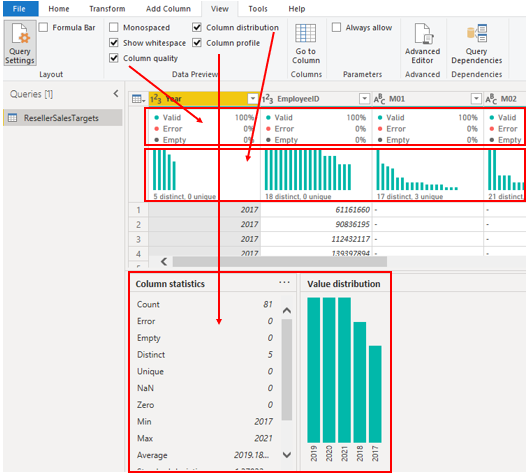
Column details - Power Query Editor has the following three data preview options that you can use to analyze the metadata that is associated with your columns. You can find these options on the View tab, as illustrated in the following screenshot.
Column quality - Determines what percentage of items in the column are valid, have errors, or are empty. If the Valid percentage is not 100, you should investigate the reason, correct the errors, and populate empty values.
Column distribution - Displays frequency and distribution of the values in each of the columns. You will investigate this further later in this module.
Column profile - Shows column statistics chart and a column distribution chart.
Auto date/time feature
When optimizing performance in Power BI Desktop, consider the Auto date/time option. This feature is enabled by default, leading Power BI Desktop to create a hidden calculated table for each date column under specific conditions, adding to your existing semantic model tables.
The Auto date/time option is useful for time intelligence operations, such as filtering, grouping, and drilling down by calendar periods. It’s recommended to keep this option enabled only if you are working with calendar periods and have simple model requirements regarding time.
If your data source includes a date dimension table, use that table to consistently define time within your organization and disable the global Auto date/time option. Disabling this option can decrease the semantic model size and reduce refresh times.
You can enable or disable the Auto date/time option globally for all Power BI Desktop files or for individual files. To adjust this setting, go to File > Options and settings > Options, then choose either the Global or Current File page. On the chosen page, select Data Load, and in the Time Intelligence section, check or uncheck the box as needed.
SWETA SARANGI
12-06-2024
