Work with tables in PowerBI

Enhancing the user experience with your semantic model is achievable by reducing the number of tables. For instance, if you've imported numerous tables from diverse data sources, resulting in a cluttered visual, it's crucial to streamline your semantic model and table arrangement before initiating report development.
A streamlined table structure will:
Facilitate easy navigation due to specific and user-friendly column and table properties.
Simplify the data structure by incorporating merged or appended tables.
Establish meaningful, high-quality relationships between tables.
For detailed guidance on optimizing your tables for a clear and user-friendly structure, refer to the subsequent sections.
Configure semantic model and build relationships between tables
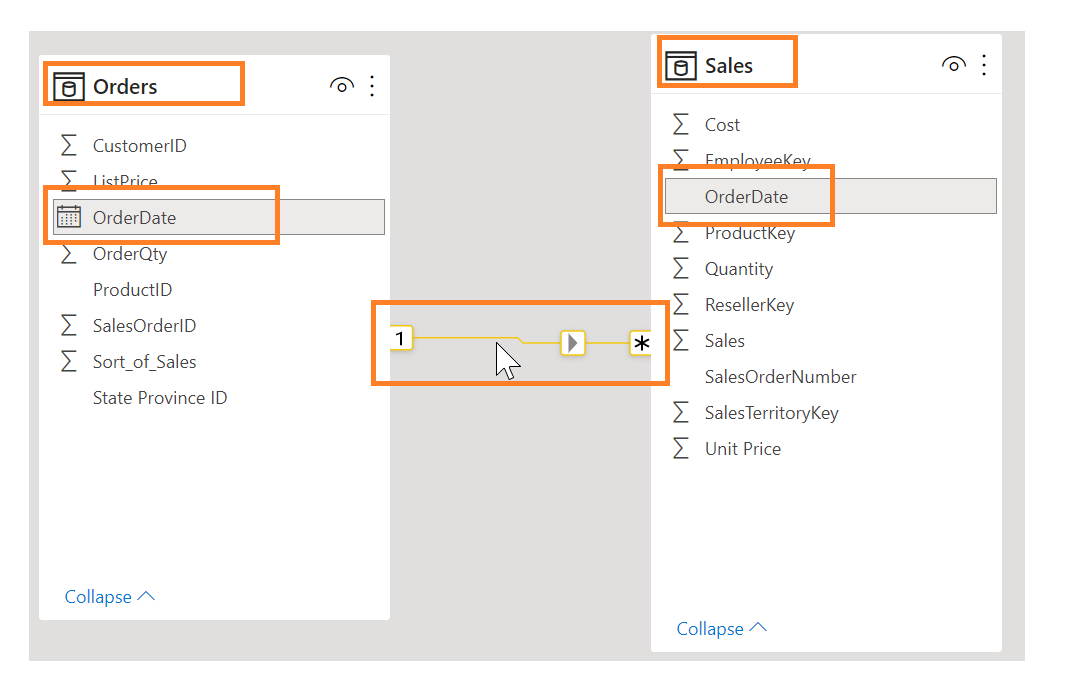
After fetching and refining your data in Power Query, proceed to the Model tab, housing the semantic model. The illustration below demonstrates the connection between the Order and Sales tables, depicted by the OrderDate column.
To manage these relationships, go to Manage Relationships on the ribbon, where the following window will appear.
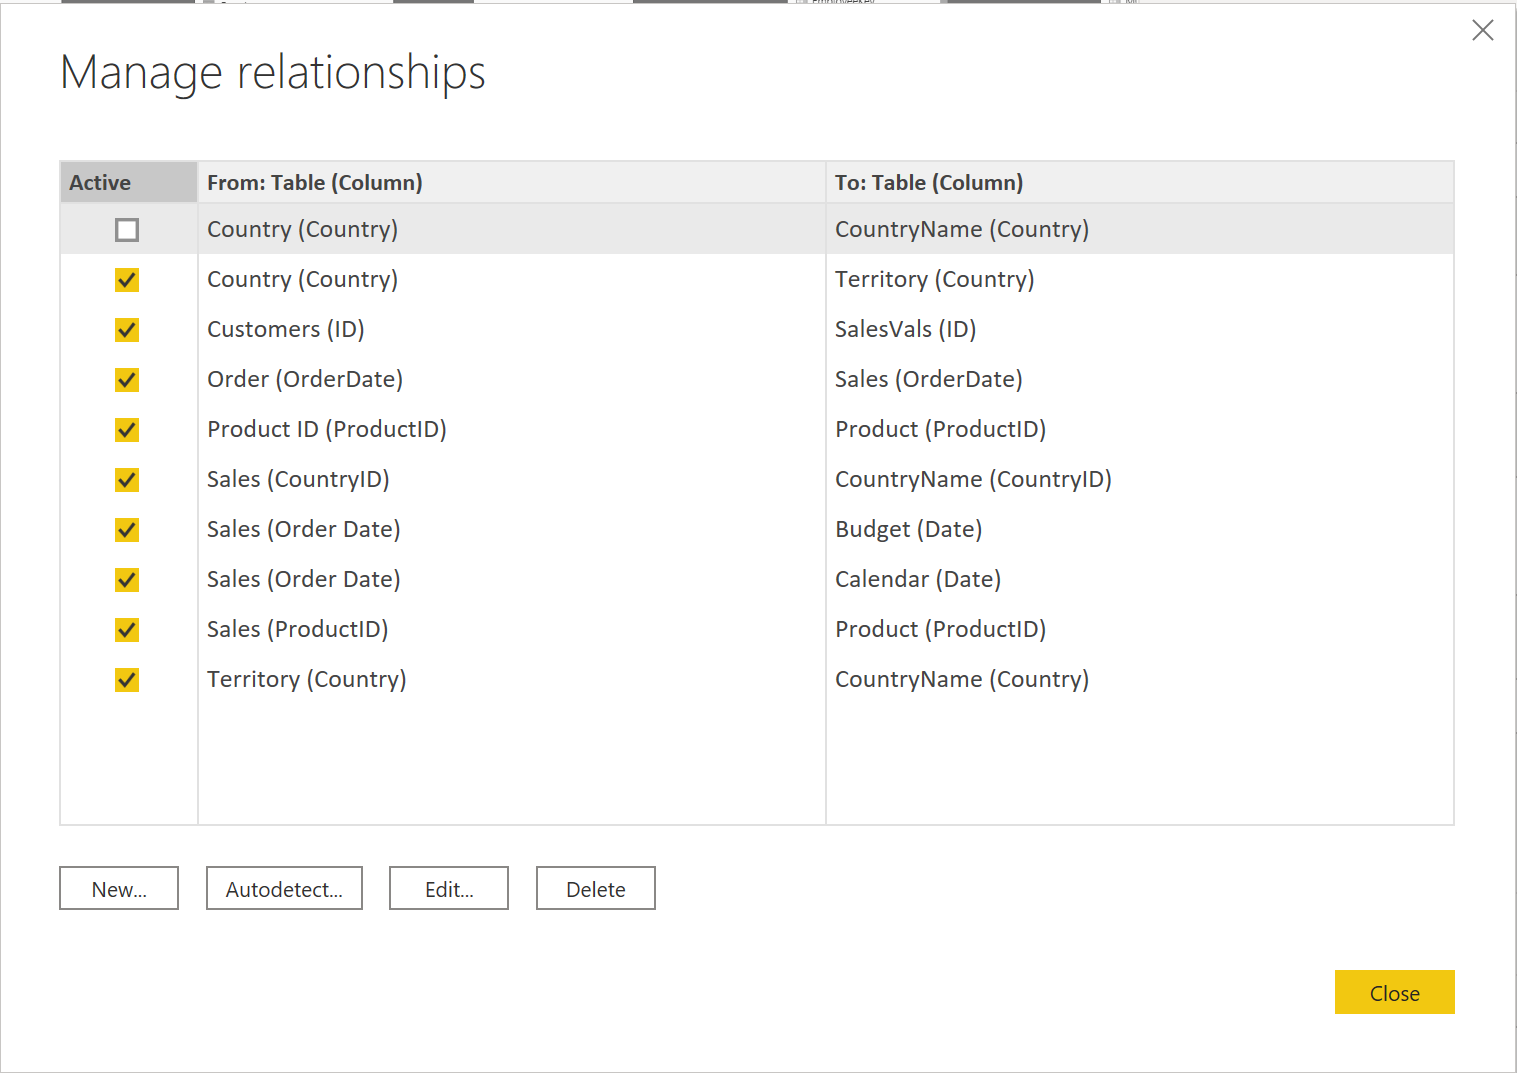
Within this interface, users have the capability to generate, modify, or remove connections between tables, including the automatic identification of pre-existing relationships. When importing data into Power BI, the Autodetect functionality aids in establishing connections between columns with similar names. Relationships may be categorized as either active or inactive, with a limitation of one active relationship between tables, a topic explored in a subsequent module.
The Manage Relationships feature not only facilitates the setup of table connections but also enables the configuration of table and column properties. This dual functionality ensures the systematic organization of the table structure.
Configure table and column properties
The Model view in Power BI desktop provides many options within the column properties that you can view or update. A simple method to get to this menu to update the tables and fields is by Ctrl+clicking or Shift+clicking items on this page.
Under the General tab, you can:
Edit the name and description of the column.
Add synonyms that can be used to identify the column when you are using the Q&A feature.
Add a column into a folder to further organize the table structure.
Hide or show the column.
Under the Formatting tab, you can:
Change the data type.
Format the date.
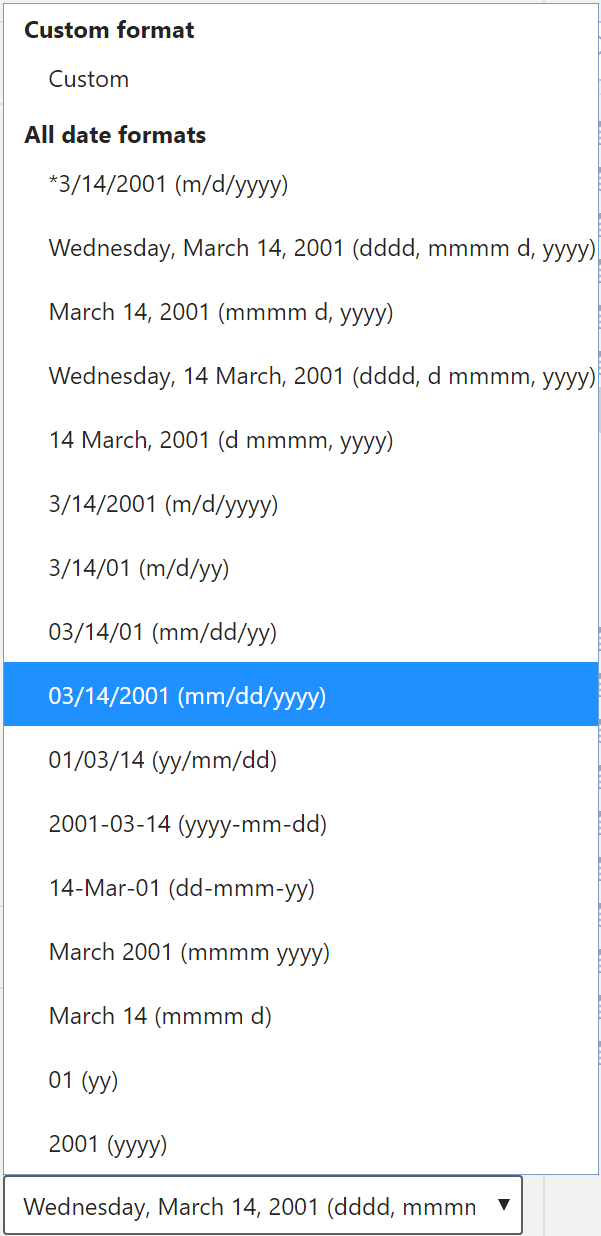
For instance, suppose that the dates in your column are formatted, as seen in the previous screenshot, in the form of "Wednesday, March 14, 2001". If you want to change the format so that the date was in the "mm/dd/yyyy" format, you would select the drop-down menu under All date time formats and then choose the appropriate date format, as shown in the following figure.
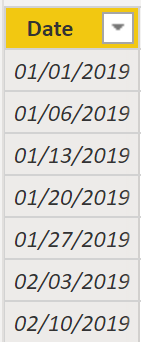
After selecting the appropriate date format, return to the Date column, where you should see that the format has indeed changed, as shown in the following figure.
Under the Advanced tab, you can:
Sort by a specific column.
Assign a specific category to the data.
Summarize the data.
Determine if the column or table contains null values.
Additionally, Power BI has a new functionality to update these properties on many tables and fields by Ctrl+clicking or Shift+clicking items.
SWETA SARANGI
29.02.2024


