Create and manage aggregations

When aggregating data, you condense it and present it at a more general level. For instance, you can compile all sales data and categorize it by date, customer, product, etc. This process of aggregation minimizes the size of tables in the semantic model, enabling you to concentrate on crucial data and enhancing query performance.
Your organization might opt to use aggregations in their semantic models for several reasons:
Improved Query Performance with Big Data: When dealing with large datasets, aggregations enhance query performance and facilitate the analysis and extraction of insights. Aggregated data is cached, which significantly reduces the resources needed compared to detailed data.
Faster Data Refresh: If experiencing slow refresh rates, aggregations can expedite the process. The smaller cache size resulting from aggregation reduces refresh time, allowing data to reach users more quickly. Instead of refreshing millions of rows, only a smaller subset of data needs updating.
Managing Large Semantic Models: For large semantic models, aggregations help in reducing and maintaining the model size.
Future-Proofing: If you expect your semantic model to grow, using aggregations now can prevent future performance, refresh, and query issues by managing the model size more effectively.
In the Tailwind Traders scenario, despite optimization efforts, the IT team has flagged the file size as still being too large at 1 gigabyte (GB). The goal is to reduce it to around 50 megabytes (MB). Upon review, it was identified that the previous developer did not implement aggregations in the semantic model. To address this, you plan to create aggregations for the sales data to reduce the file size and enhance performance.
Create aggregations
Before creating aggregations, you need to decide on the level (grain) at which you want to aggregate the data. In this case, you aim to aggregate the sales data at the day level.
Once you have determined the grain, the next step is to decide on the method for creating the aggregations. There are several ways to achieve this, and each will yield the same results. For example:
Database Table: If you have access to the database, you could create a table with the aggregated data and then import it into Power BI Desktop.
Database View: Alternatively, if you have access to the database, you could create a view for the aggregated data and import that view into Power BI Desktop.
Power Query Editor: Within Power BI Desktop, you can use the Power Query Editor to create the aggregations step-by-step.
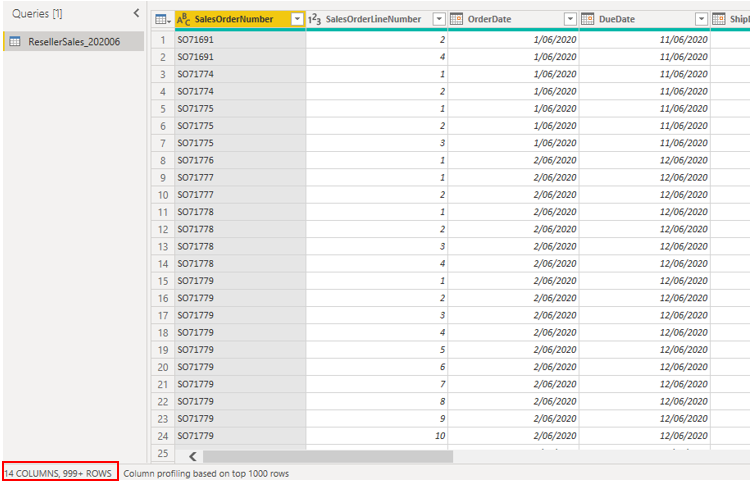
In this scenario, you open a query in the Power Query Editor and notice that the data is not yet aggregated; it contains over 999 rows, as shown in the following screenshot.
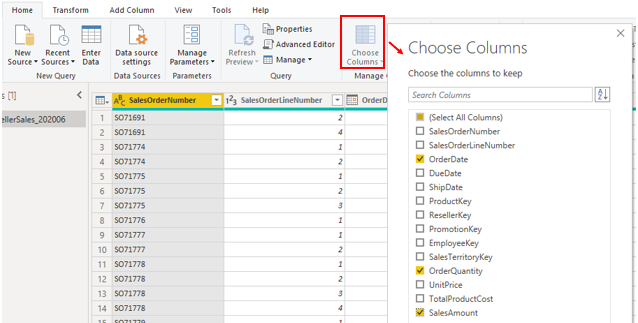
You want to aggregate the data by the OrderDate column and view the OrderQuantity and SalesAmount columns. Start by selecting Choose Columns on the Home tab. On the window that displays, select the columns that you want in the aggregation and then select OK.
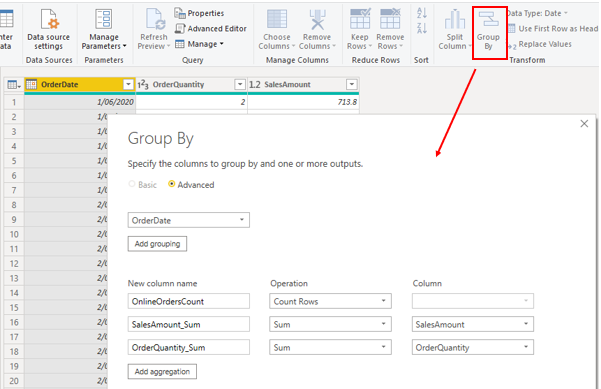
When the selected columns display on the page, select the Group By option on the Home tab. On the window that displays, select the column that you want to group by (OrderDate) and enter a name for the new column (OnlineOrdersCount).
Select the Advanced option and then select the Add aggregation button to display another column row. Enter a name for the aggregation column, select the operation of the column, and then select the column to which you want to link the aggregation. Repeat these steps until you have added all the aggregations and then select OK.
It might take a few minutes for your aggregation to display, but when it does, you'll see how the data has been transformed. The data will be aggregated into each date, and you will be able to see the values for the orders count and the respective sum of the sales amount and order quantity.

Select the Close and Apply button to close Power Query Editor and apply the changes to your semantic model. Return to the Power BI Desktop page and then select the Refresh button to see the results. Observe the screen because a brief message will display the number of rows that your semantic model now has. This number of rows should be significantly less than the number that you started with. You can also see this number when you open Power Query Editor again, as illustrated in the following screenshot. In this example, the number of rows was reduced to 30.

Remember, you started with over 999 rows. Using aggregation has significantly reduced the number of rows in your semantic model, which means that Power BI has less data to refresh and your model should perform better.
Manage aggregations
When you have created aggregations, you can manage those aggregations in Power BI Desktop and make changes to their behavior, if required.
You can open the Manage Aggregations window from any view in Power BI Desktop. In the Fields pane, right-click the table and then select Manage aggregations.

For each aggregation column, you can select an option from the Summarization drop-down list and make changes to the selected detail table and column. When you are finished managing the aggregations, select Apply All.
SWETA SARANGI
24.06.2024


