Explore Power BI Desktop

Hands-on Power BI Desktop
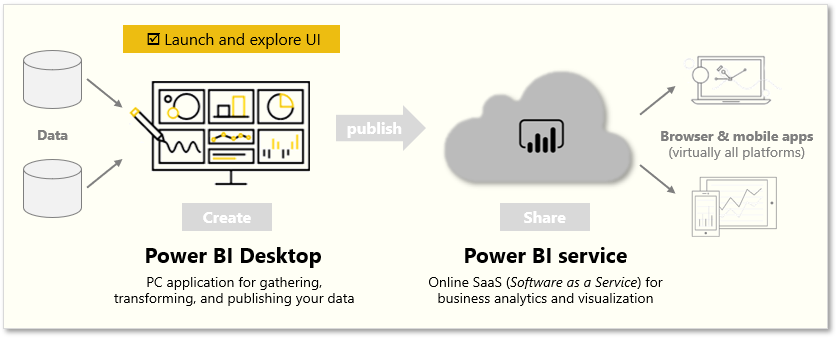
The idea of building and sharing reports can be difficult to understand at first. However, it becomes much easier to grasp once you start using Power BI Desktop. The first step is to launch the application and explore the user interface (UI). The UI is divided into several sections, each of which contains different tools and features that you can use to create and share reports. By taking some time to familiarize yourself with the UI, you will be well on your way to becoming a Power BI expert.
In this article, we will be covering:
-How to launch Power BI desktop
-How to explore UI
Launch Power BI Desktop
When you first launch Power BI Desktop, a dialog box will appear with links to helpful resources, such as forums, blogs, and introductory videos. You can close this dialog box for now, but be sure to select the "Show this screen on startup" option so that you can easily access it later.
Explore the report building environment
In Power BI Desktop, you'll begin to build reports in the Report view. You'll be working in five main areas:
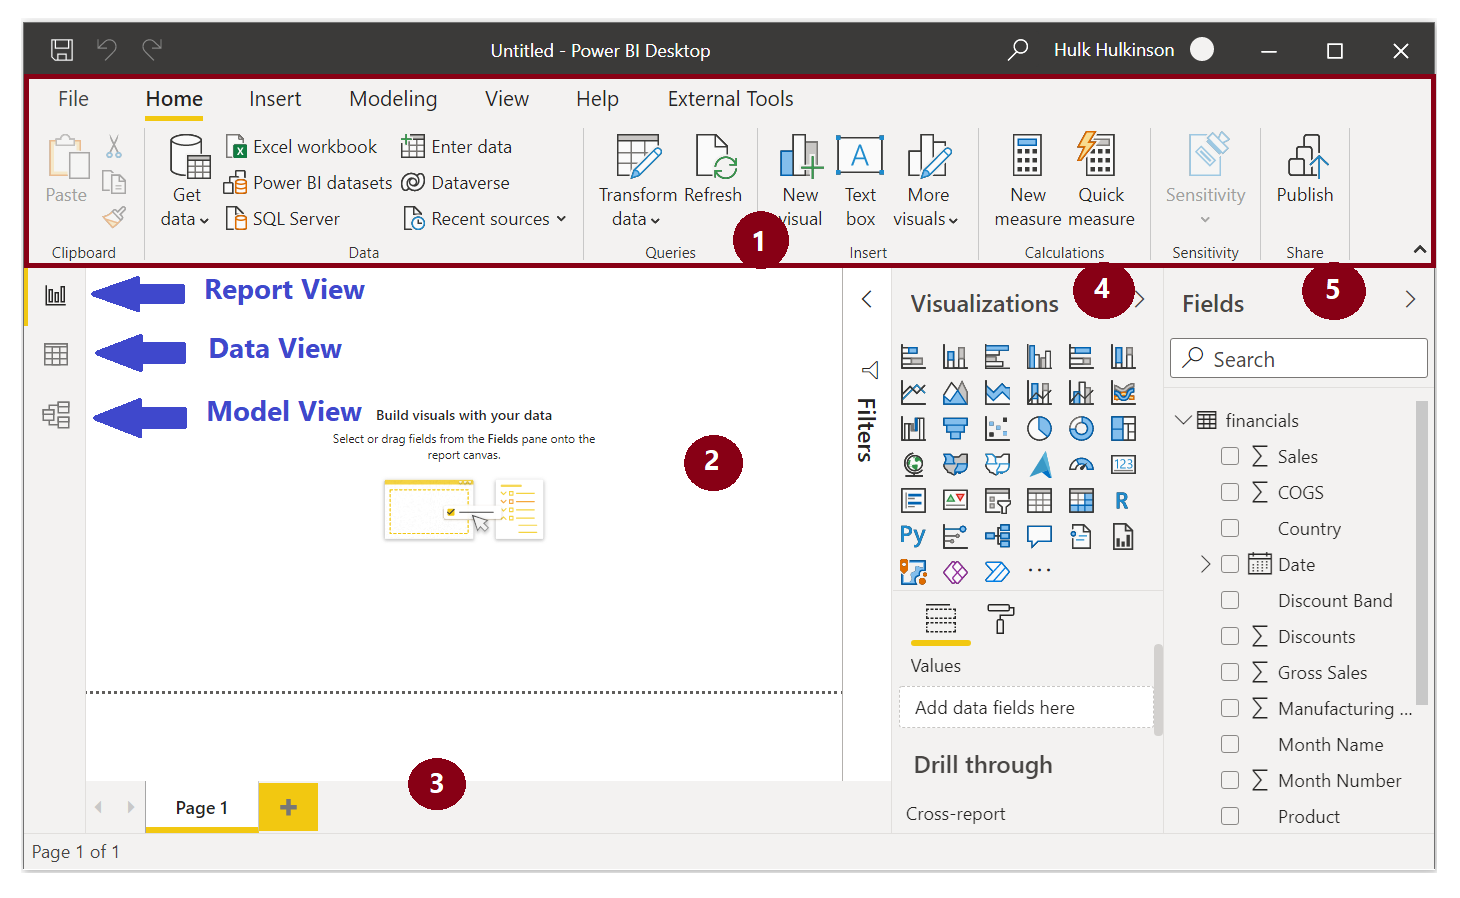
Ribbon - Displays common tasks that are associated with reports and visualizations.
Report view, or canvas - Where visualizations are created and arranged. You can switch between Report, Data, and Model views by selecting the icons in the left column.
Pages tab - Located along the bottom of the page, this area is where you would select or add a report page.
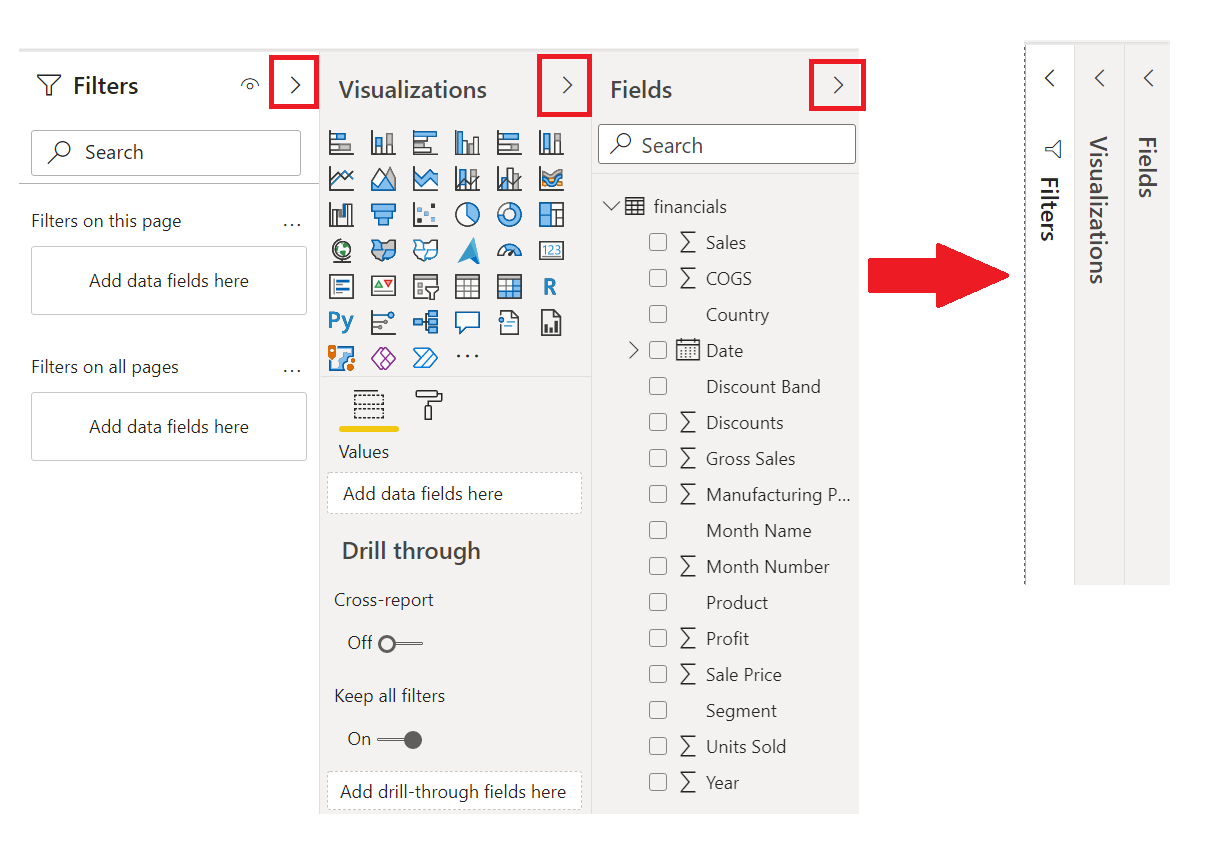
Visualizations pane - Where you can change visualizations, customize colors or axes, apply filters, drag fields, and more.
Fields pane - Where query elements and filters can be dragged onto the Report view or dragged to the Filters area of the Visualizations pane.
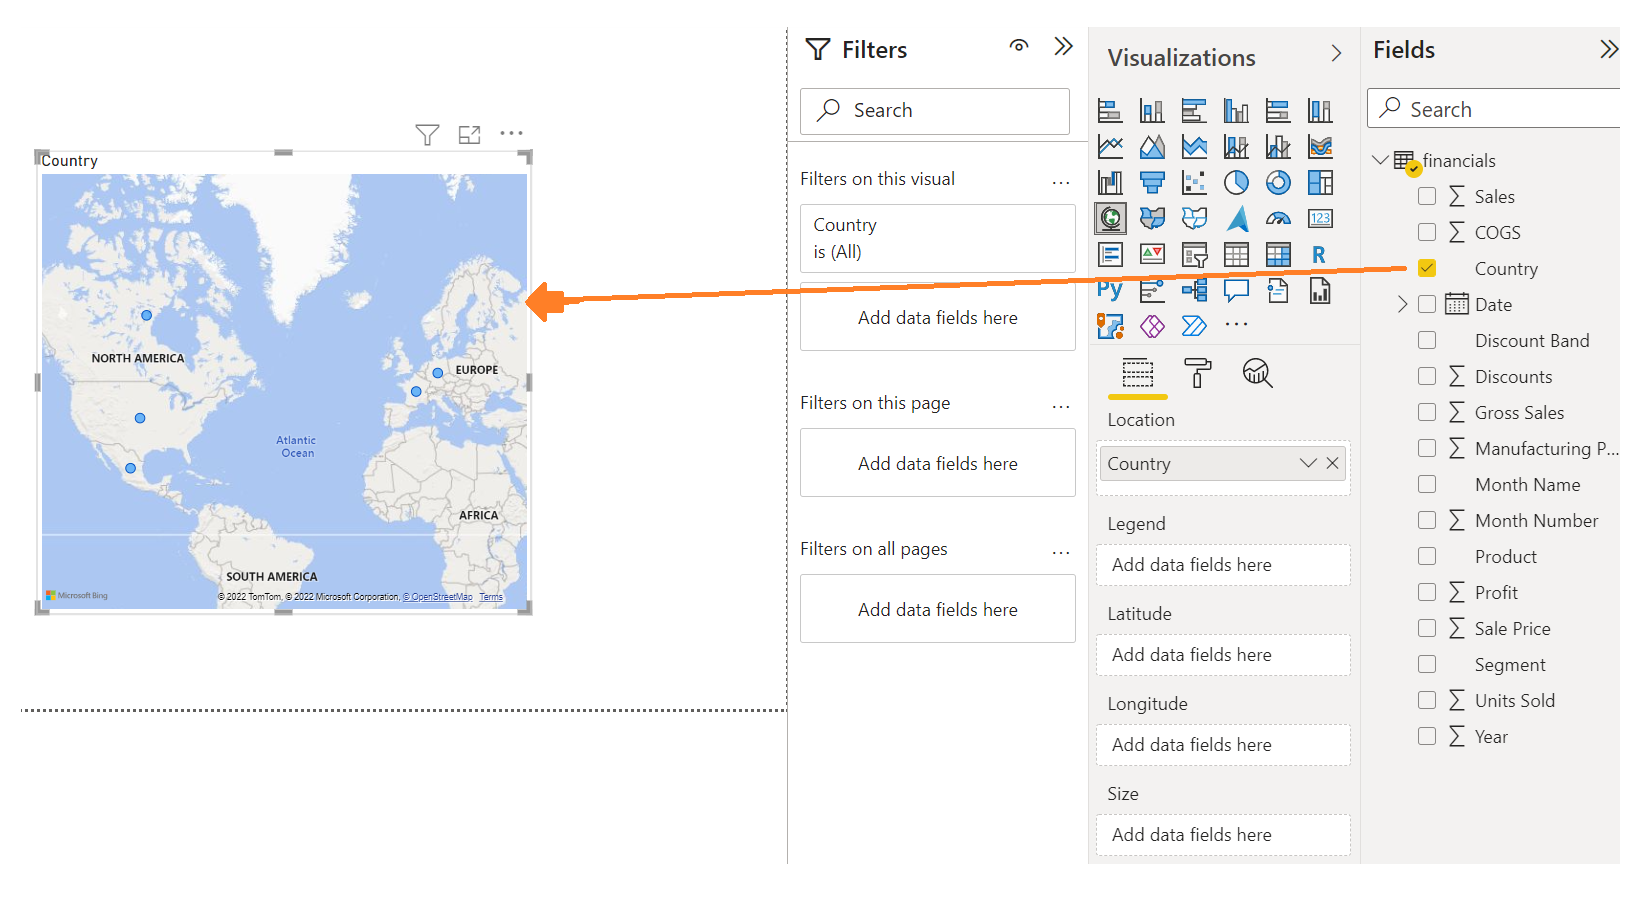
Create Visuals
To create a visual, drag a field from the Fields list onto the Report view.
Publish a report
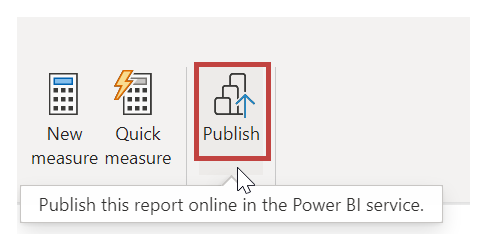
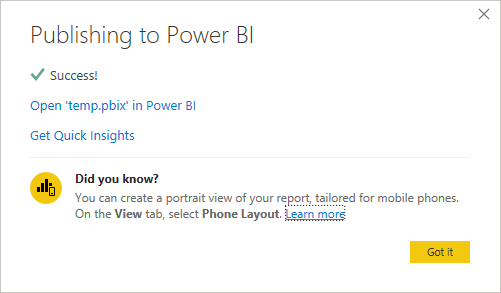
Once you have created a report with some visuals, you can publish it to the Power BI service. To do this, select "Publish" on the Home ribbon in Power BI Desktop. You will be prompted to sign in to Power BI. Once you have signed in and the publish process is complete, a dialog box will appear with a link that says "Success!". You can click this link to open the Power BI service and see your published report.
Pin a visual to dashboard
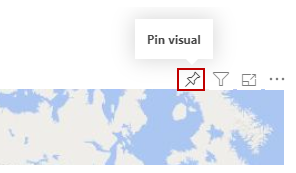
When you view a published report in the Power BI service, you can choose the Pin icon to pin that visual to a dashboard.You can choose whether to pin the visual to an existing dashboard or to create a new dashboard.
SWETA SARANGI


