Star schema design

While it's uncommon for a Power BI semantic model to consist of just one table, such a single-table model may serve well for simpler tasks like data exploration or proof of concept. However, it's not the optimal model design. The ideal approach follows star schema principles, widely used in relational data warehouses. Star schema provides a user-friendly structure and enables high-performance analytic queries.
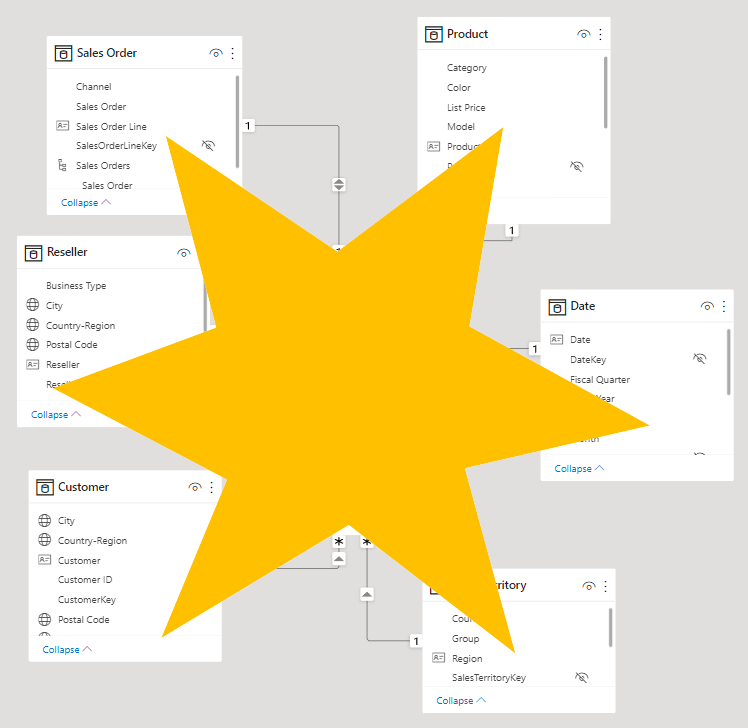
This design principle, named star schema, categorizes model tables into fact and dimension tables. In a visual representation, a fact table is positioned at the center, resembling a star, surrounded by dimension tables that form the points of the star.
Fact Tables
Fact tables serve as repositories for accumulated rows that document various observations or events related to a particular business process. For instance, a sales fact table might store data on sales orders and their corresponding order lines. Additionally, fact tables can be utilized to record details like stock movements, stock balances, or daily currency exchange rates. Typically, these tables house a substantial number of rows, and over time, they accumulate additional data. In analytical queries, a process that will be explained later in this module, the information within fact tables is summarized to derive key values such as sales and quantity.
Dimension Tables
Dimension tables define key aspects of business entities such as individuals, locations, products, or abstract concepts. An illustration of a concept dimension table is the date dimension, where each row corresponds to a specific date. The columns within dimension tables play a crucial role in organizing and categorizing data in fact tables.
For proper functioning, each dimension table requires a unique key column, ensuring no duplicates or missing values. For instance, in a product dimension table, this key column might be denoted as ProductKey or ProductID. Additional columns in such tables capture descriptive attributes like product name, subcategory, category, color, etc. These descriptive columns are essential for filtering and grouping data in analytical queries.
Relate star schema tables
Within the model, dimension tables establish one-to-many relationships with fact tables, enabling the extension of filters and groups applied to dimension table columns to impact the fact table. This design approach is widely employed.
Dimension tables play a role in filtering multiple fact tables, and conversely, multiple dimension tables can filter a single fact table. However, linking one fact table directly to another is discouraged as it goes against best practices.
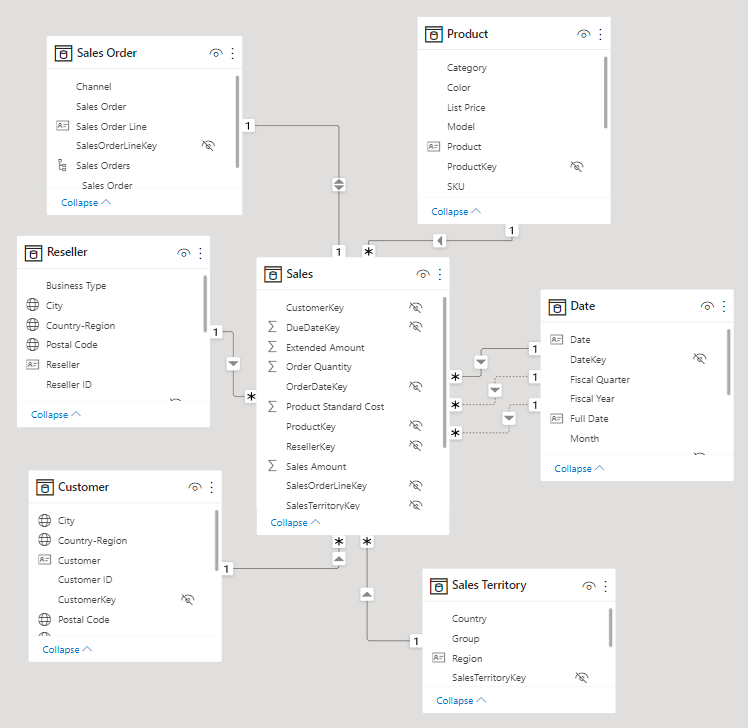
Observe that the model consists of seven tables, including one named Sales serving as the fact table. The other tables function as dimension tables, and their names are:
Customer
Date
Product
Reseller
Sales Order
Sales Territory
Take note of the relationships established between the dimension and fact tables, with each relationship indicating a filter direction directed towards the fact table. Consequently, when filters are employed on dimension table columns for purposes like filtering or grouping by column values, the associated facts undergo filtering and summarization.
On examining the pattern, we can see a star shape.
SWETA SARANGI
24.02.2024


